Role
UX Researcher
Product Designer
Timeline
12 Weeks
Team
3 NASA aeronautical engineers
1 UX Mentor
UX Student
Project Overview
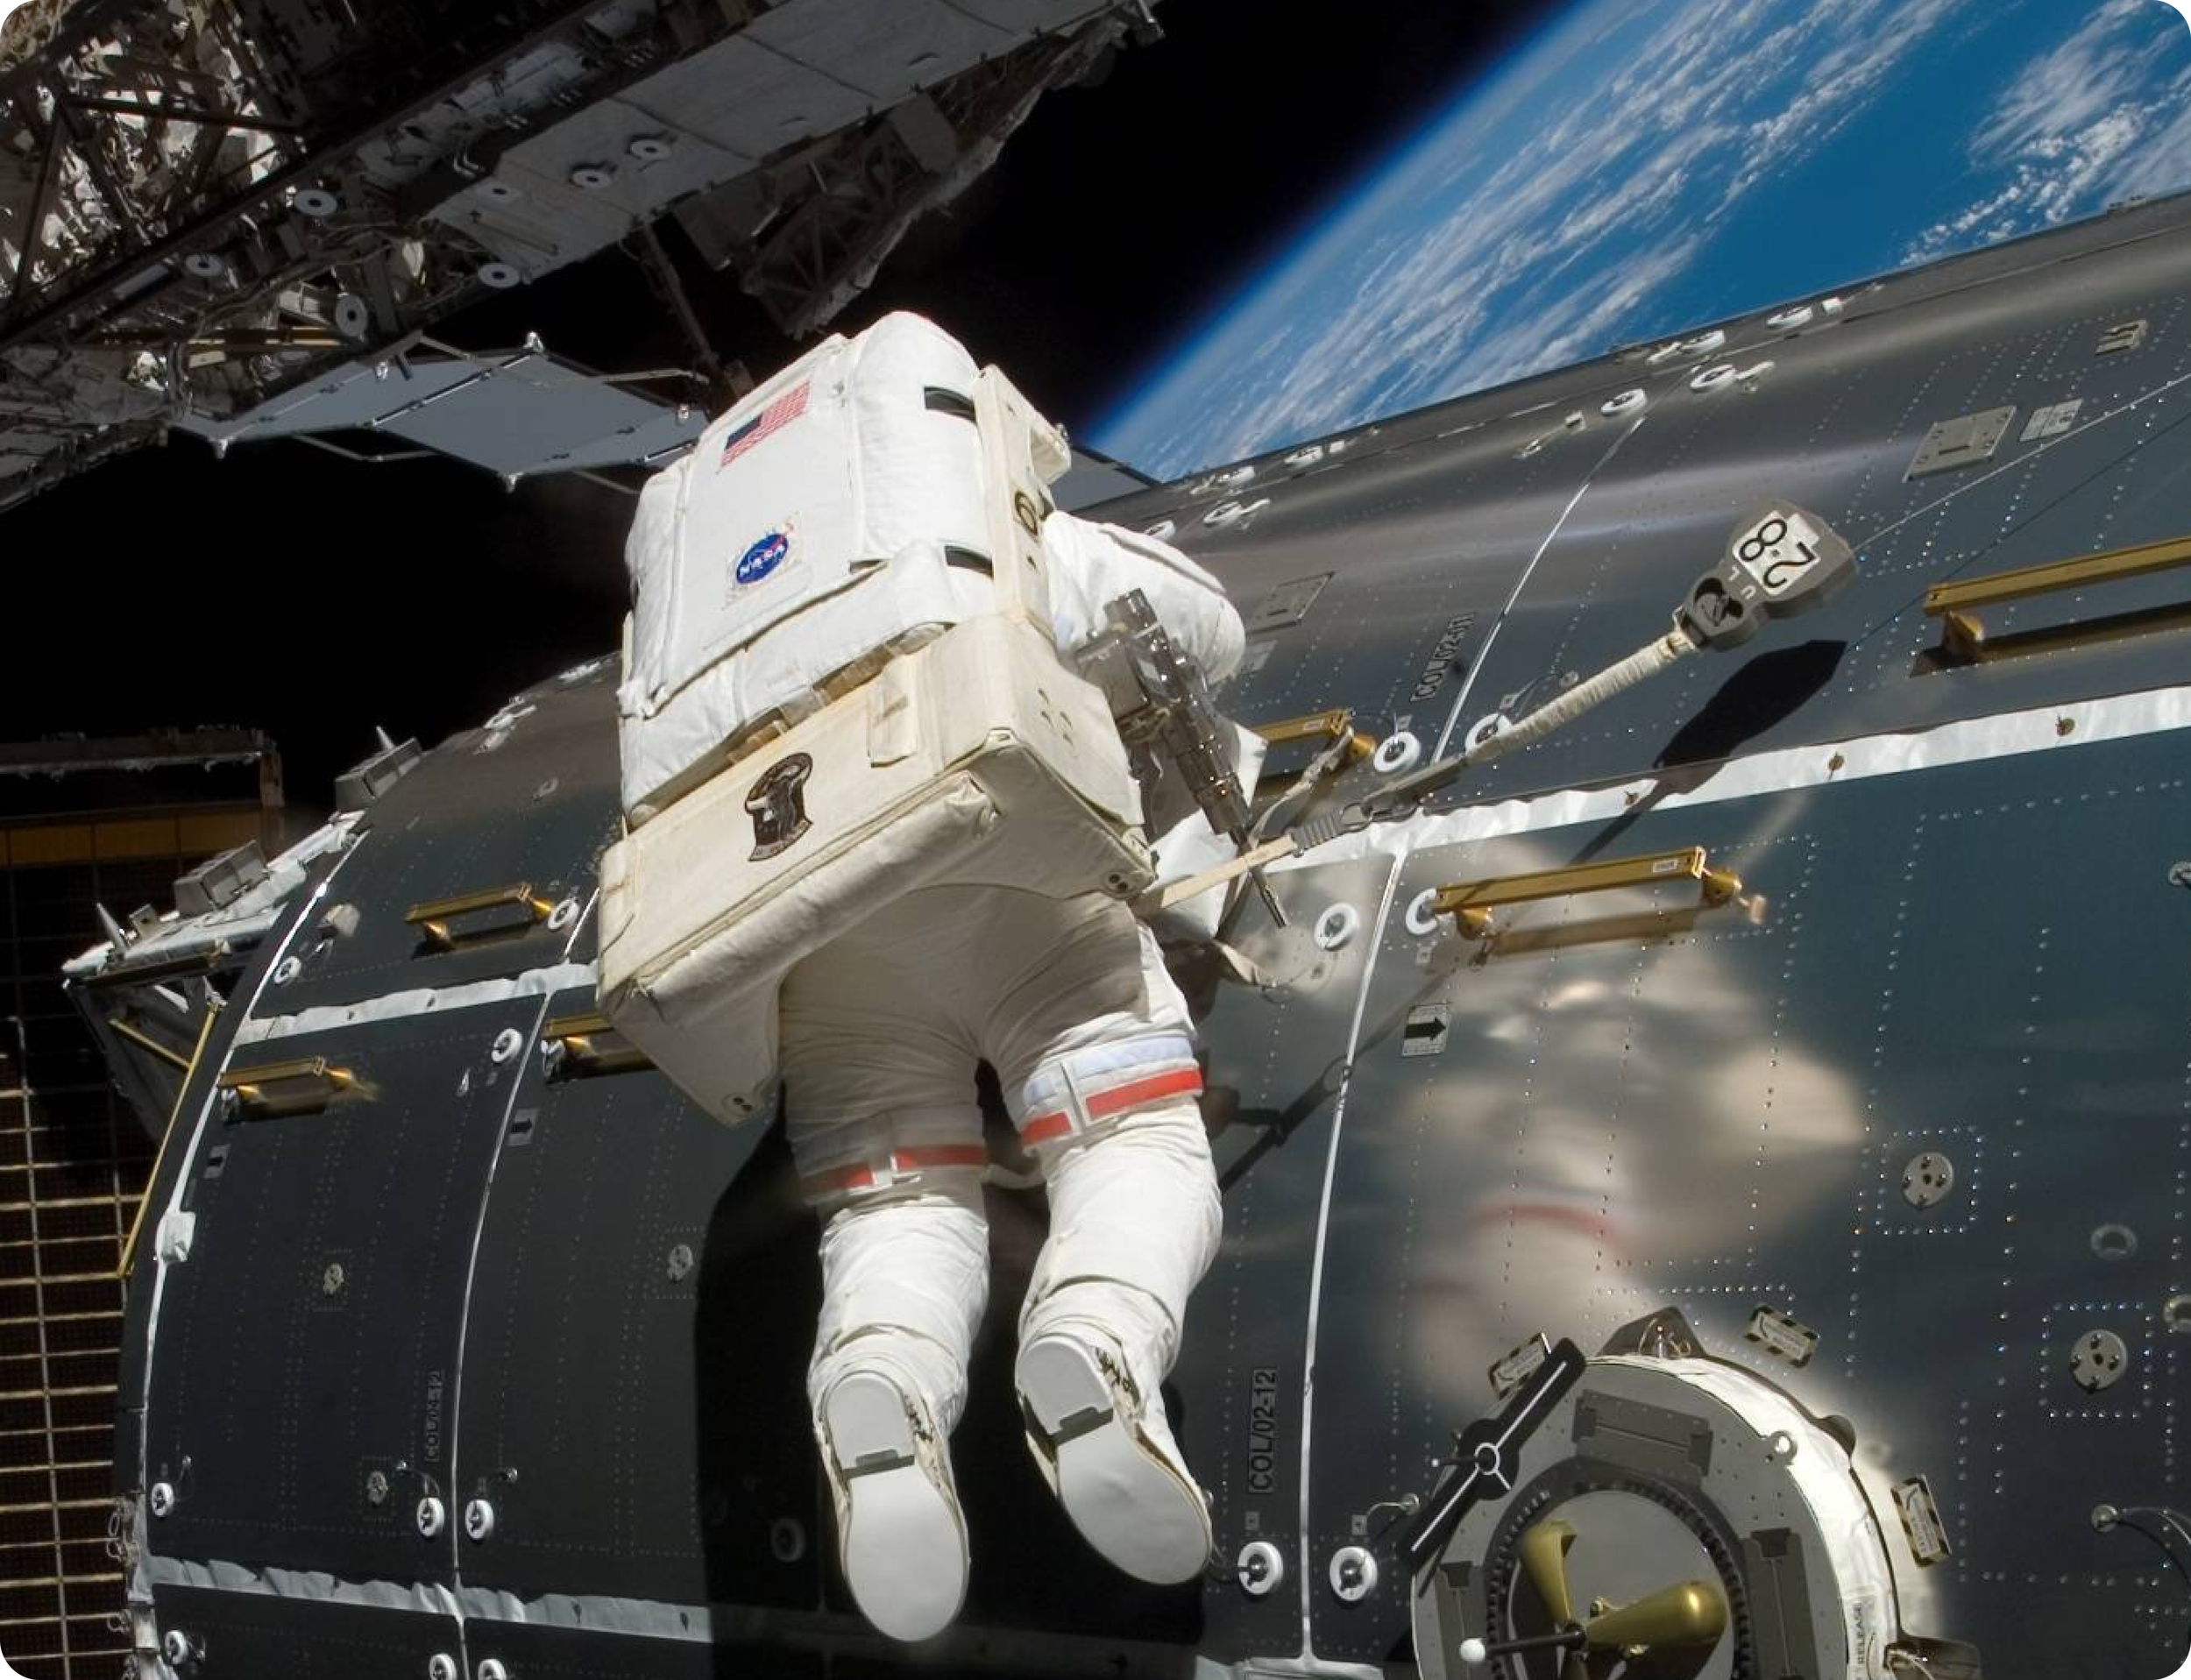
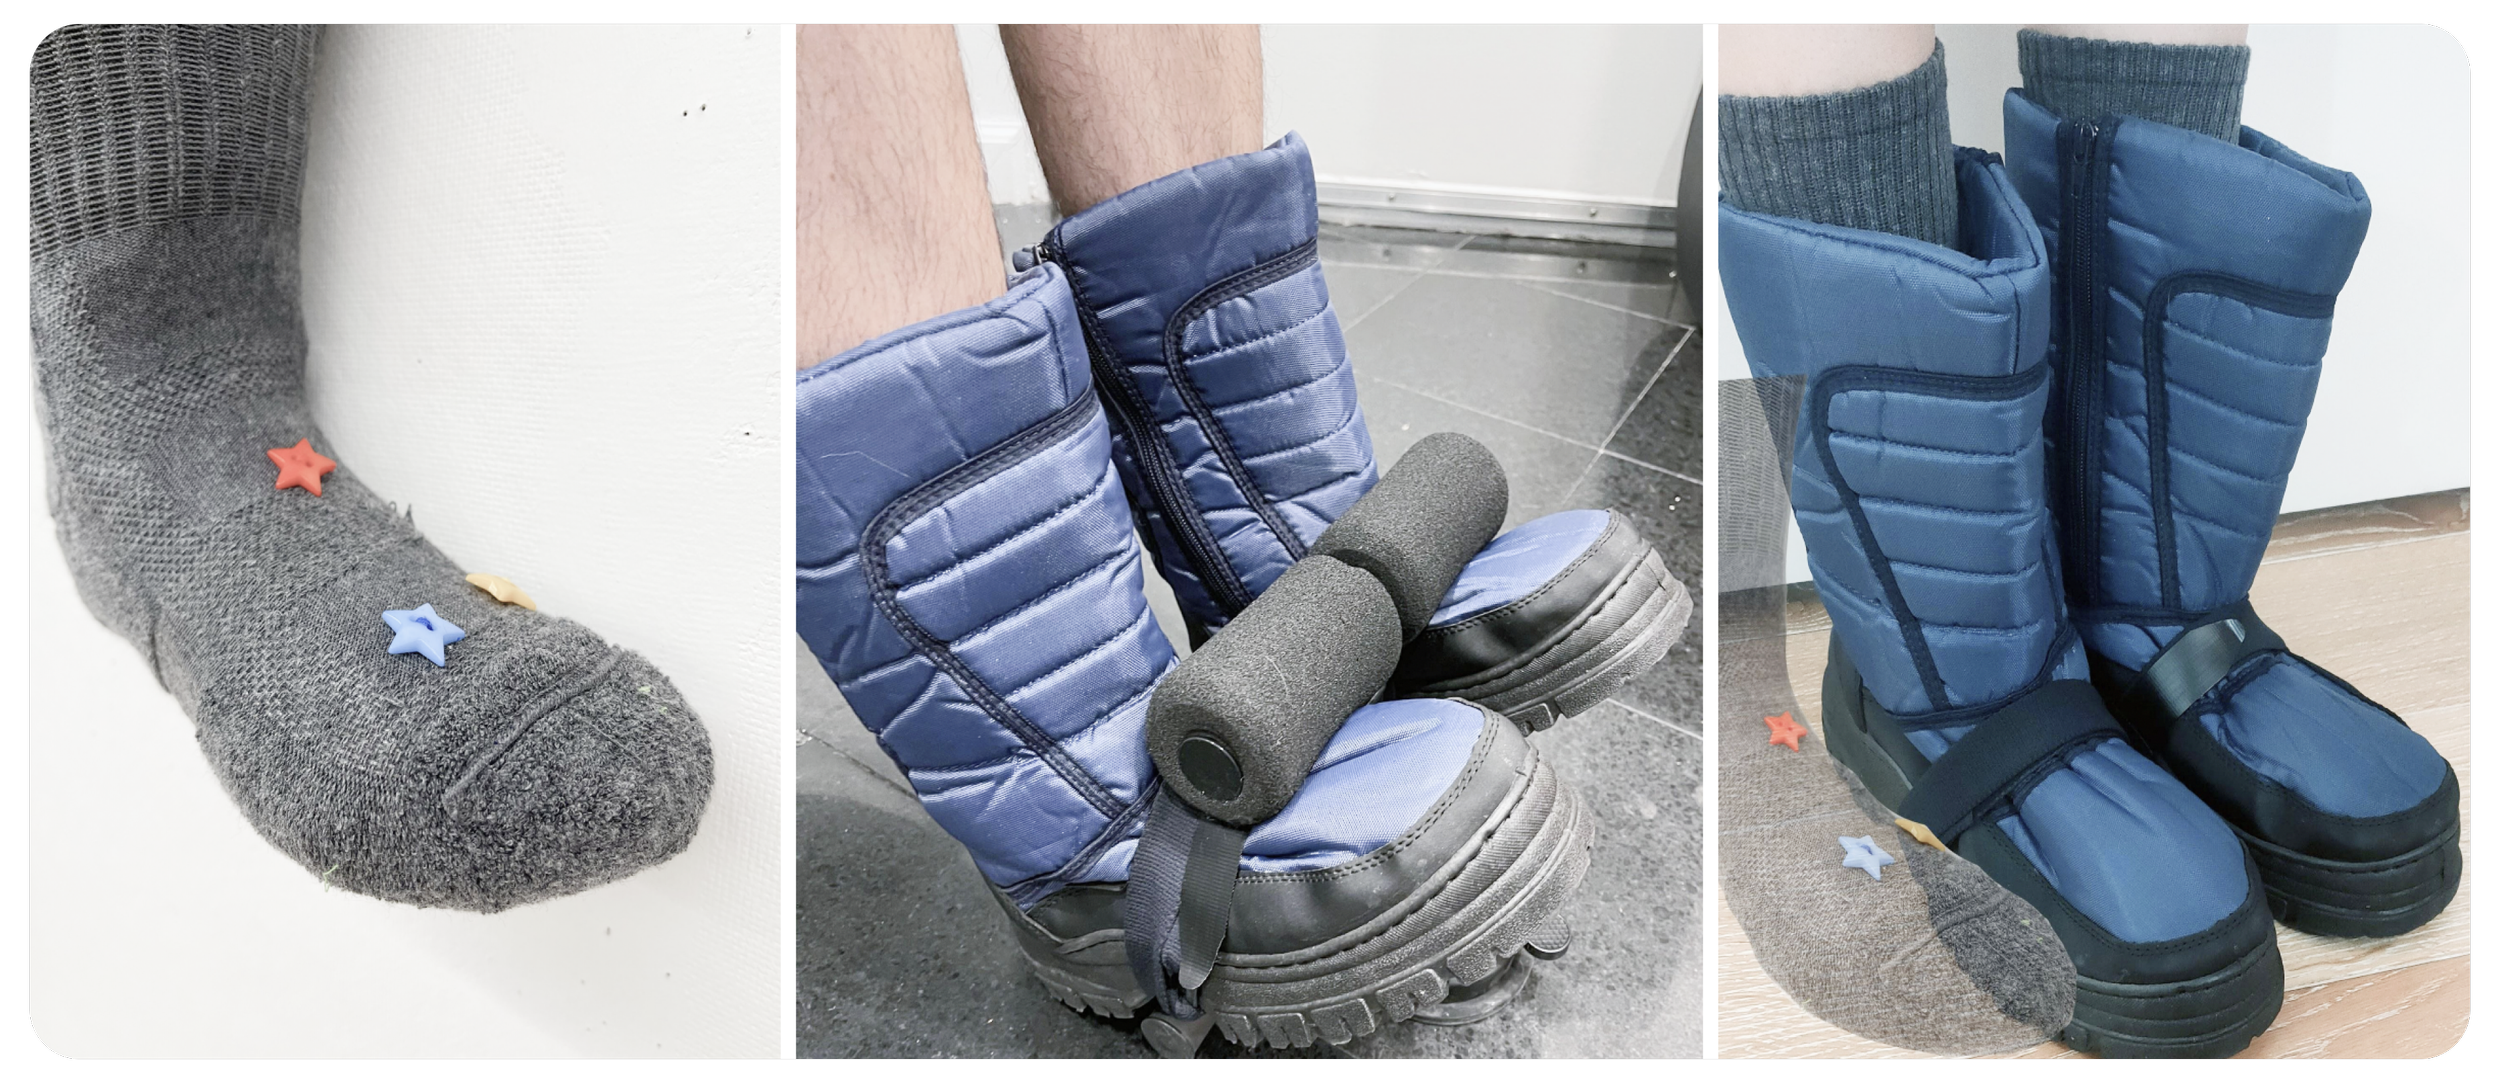
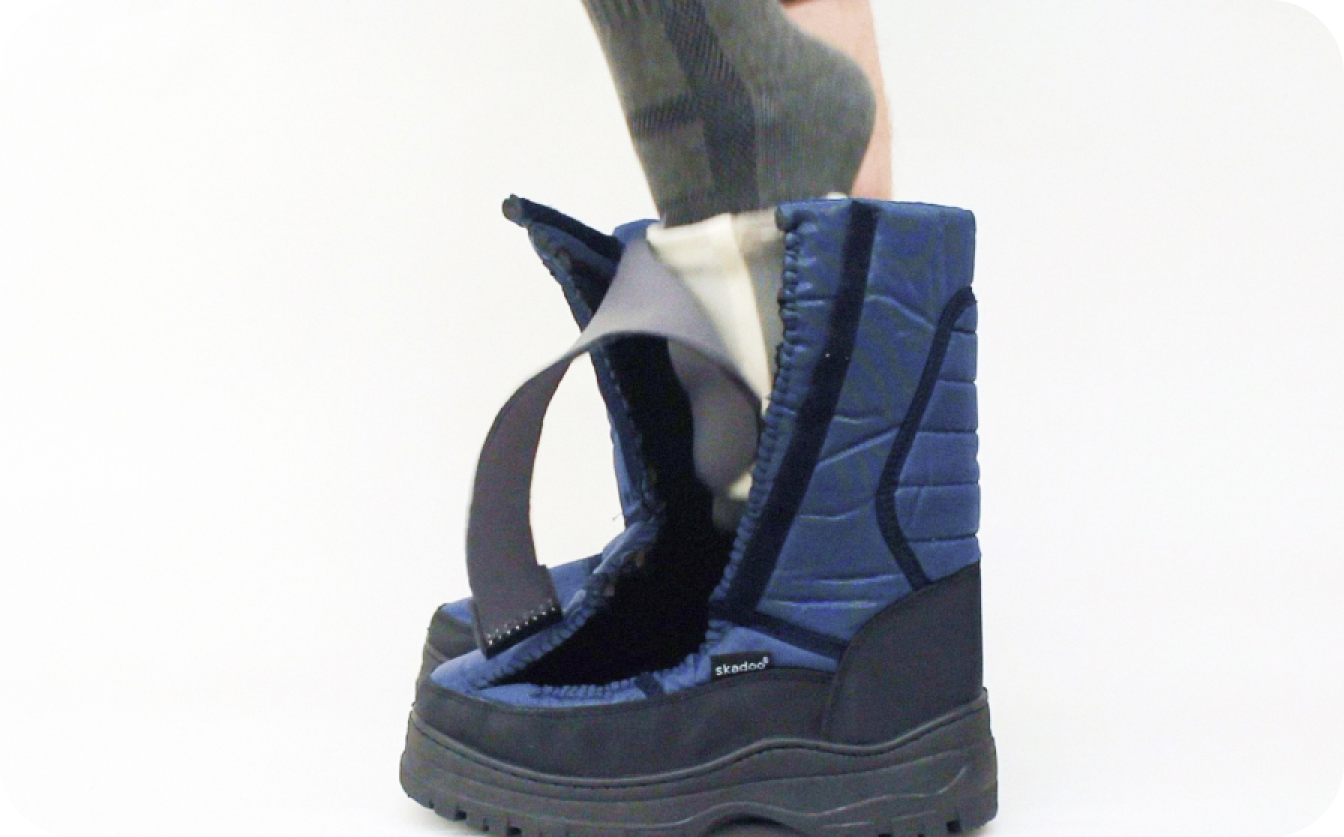
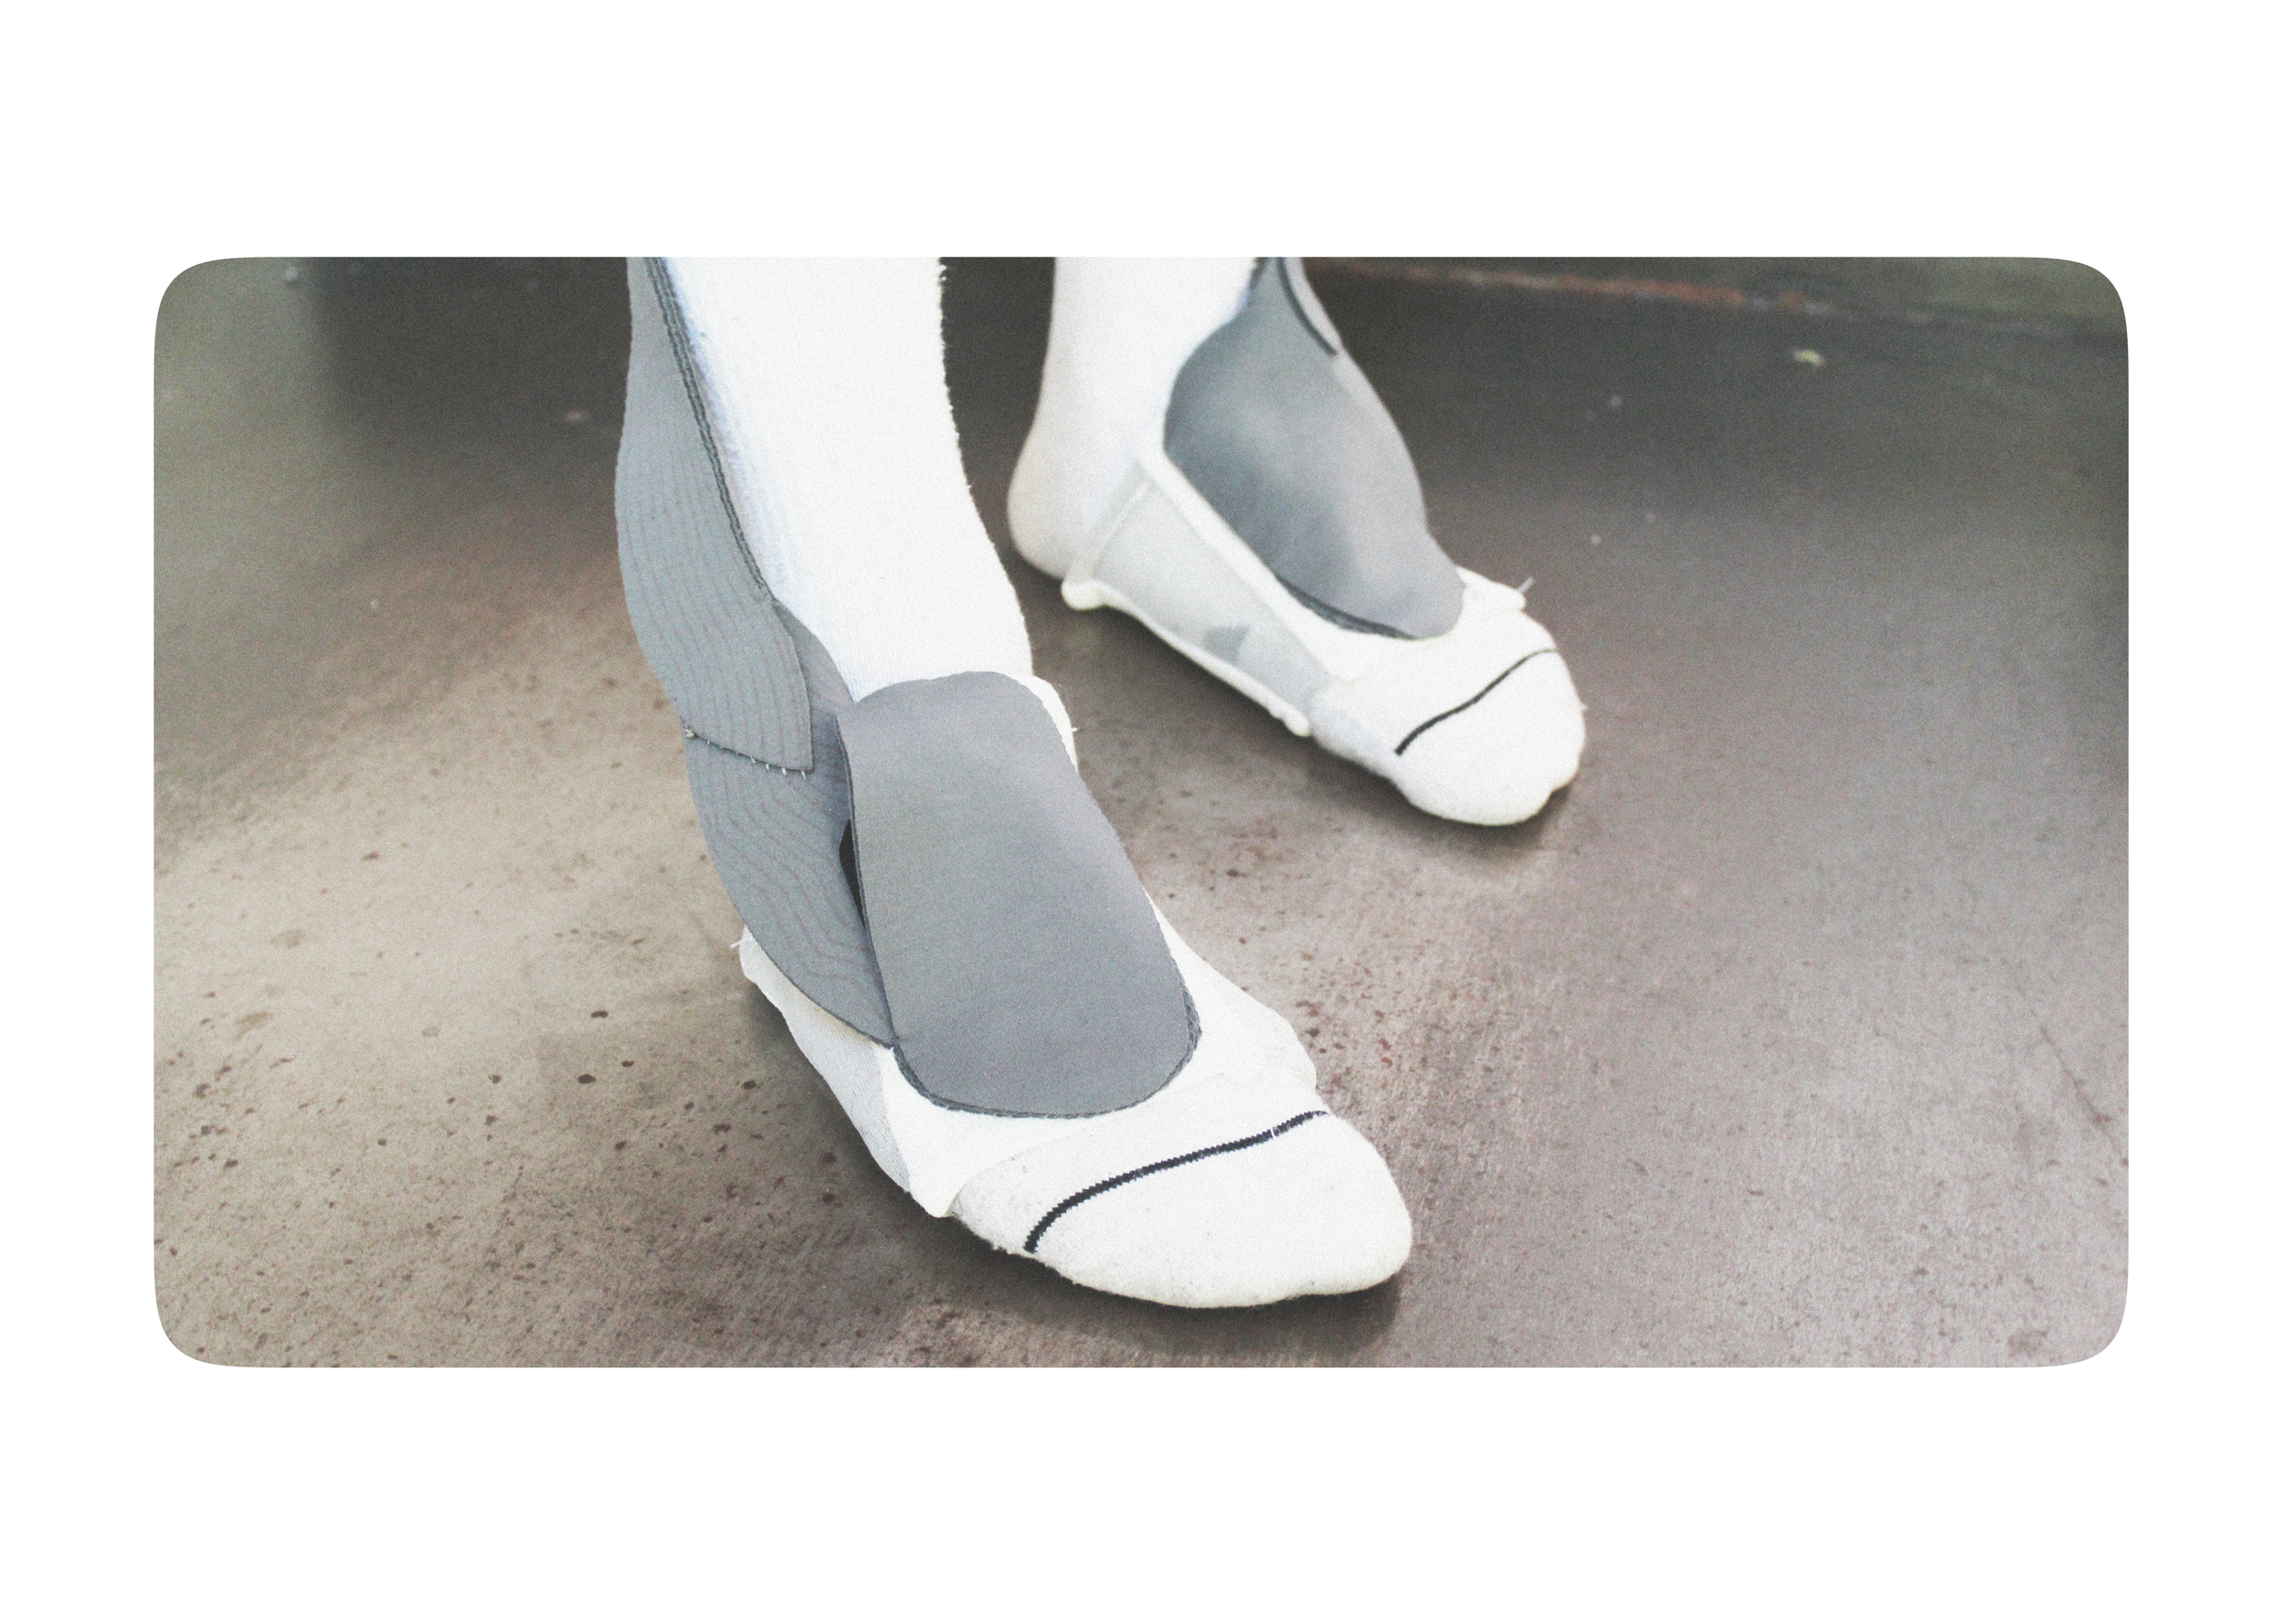
Current space suit designs have fit problems that can obstruct mission goals, resulting in injury and discomfort. Currently, there is no precise method for identifying and measuring these fit problems. As you can see, the space boots that are currently in use are so loose that astronauts have been spotted performing space walks while wearing the incorrect footwear, and the lacing that is used to tighten the boots has its own problems. In order to properly diagnose and correct fit issues, a method must be created, and that is what we aim to do with this project.
Research
In a Training Suit Symptom Study Report done by NASA, 60% of those surveyed stated that boot contact caused dorsal foot pain, making it the most problematic area of the foot in terms of suit fit and injury.
Possible Solution
In order to better understand the nature of human-space suit interaction, this project is divided into two parts. Sensors will transmit information about the astronaut's discomfort and any other areas of concern after they complete a survey requesting this information.
First Exploration
This first exploration received the name of Pebble study
We each placed pebbles in our socks, then over the course of an hour, we watched the sensations we felt.
The objective was to make notes on the kinds of observations we would expect to find in a survey, and then use those notes to reverse-engineer a survey using our findings.
familiarized ourselves with the impact that an obtrusive fit had on our experience.
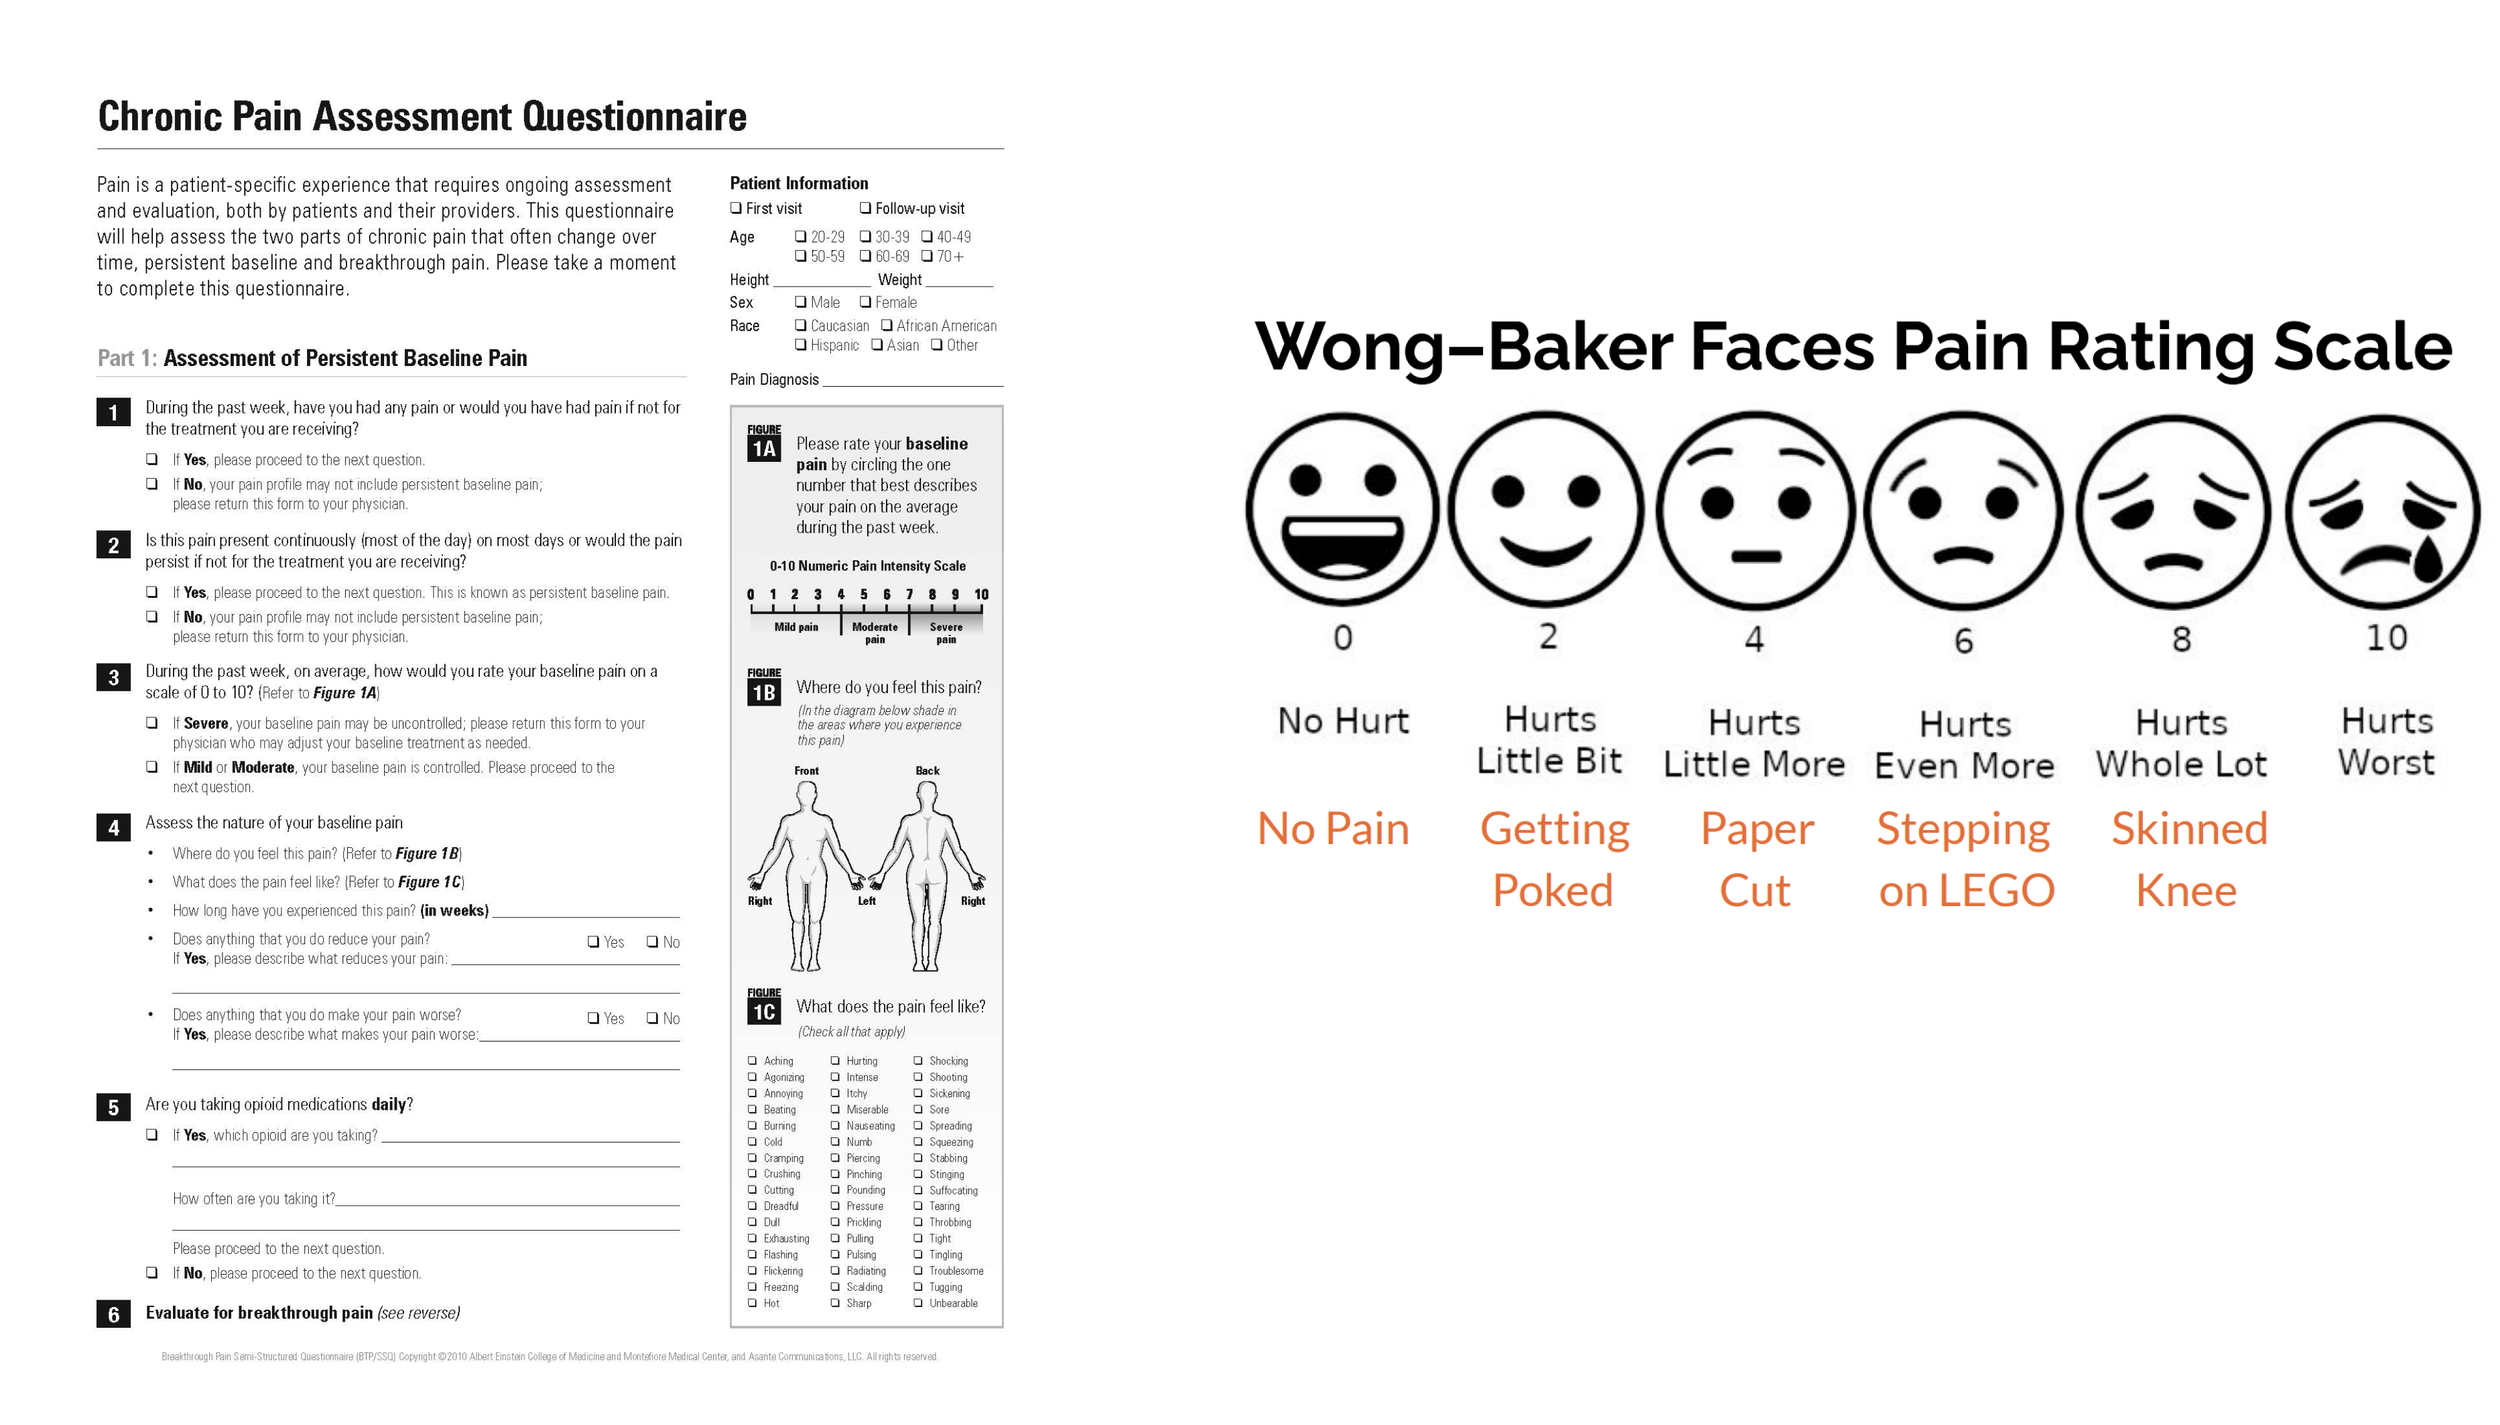
Using the proper wording was essential to identifying the type of pain the participant was experiencing, as we also learned from chronic pain assessment questionnaires from the Albert Einstein College of Medicine. in addition to the significance of the questions' formulation.
We also added our own pain references, such as getting poked and stepping on LEGO, and found Wong-Baker's faces Pain Rating Scale to be helpful because it is simpler for people to relate to.
Subsequent Exploration
Then, how can discomfort be assessed? We were able to create the best conditions for testing discomfort by modifying socks with buttons that were uncomfortable enough to report. We also mocked up the space boot with an oversized winter boot and used straps on the outside that allowed us to tighten it to each person’s foot.
Findings
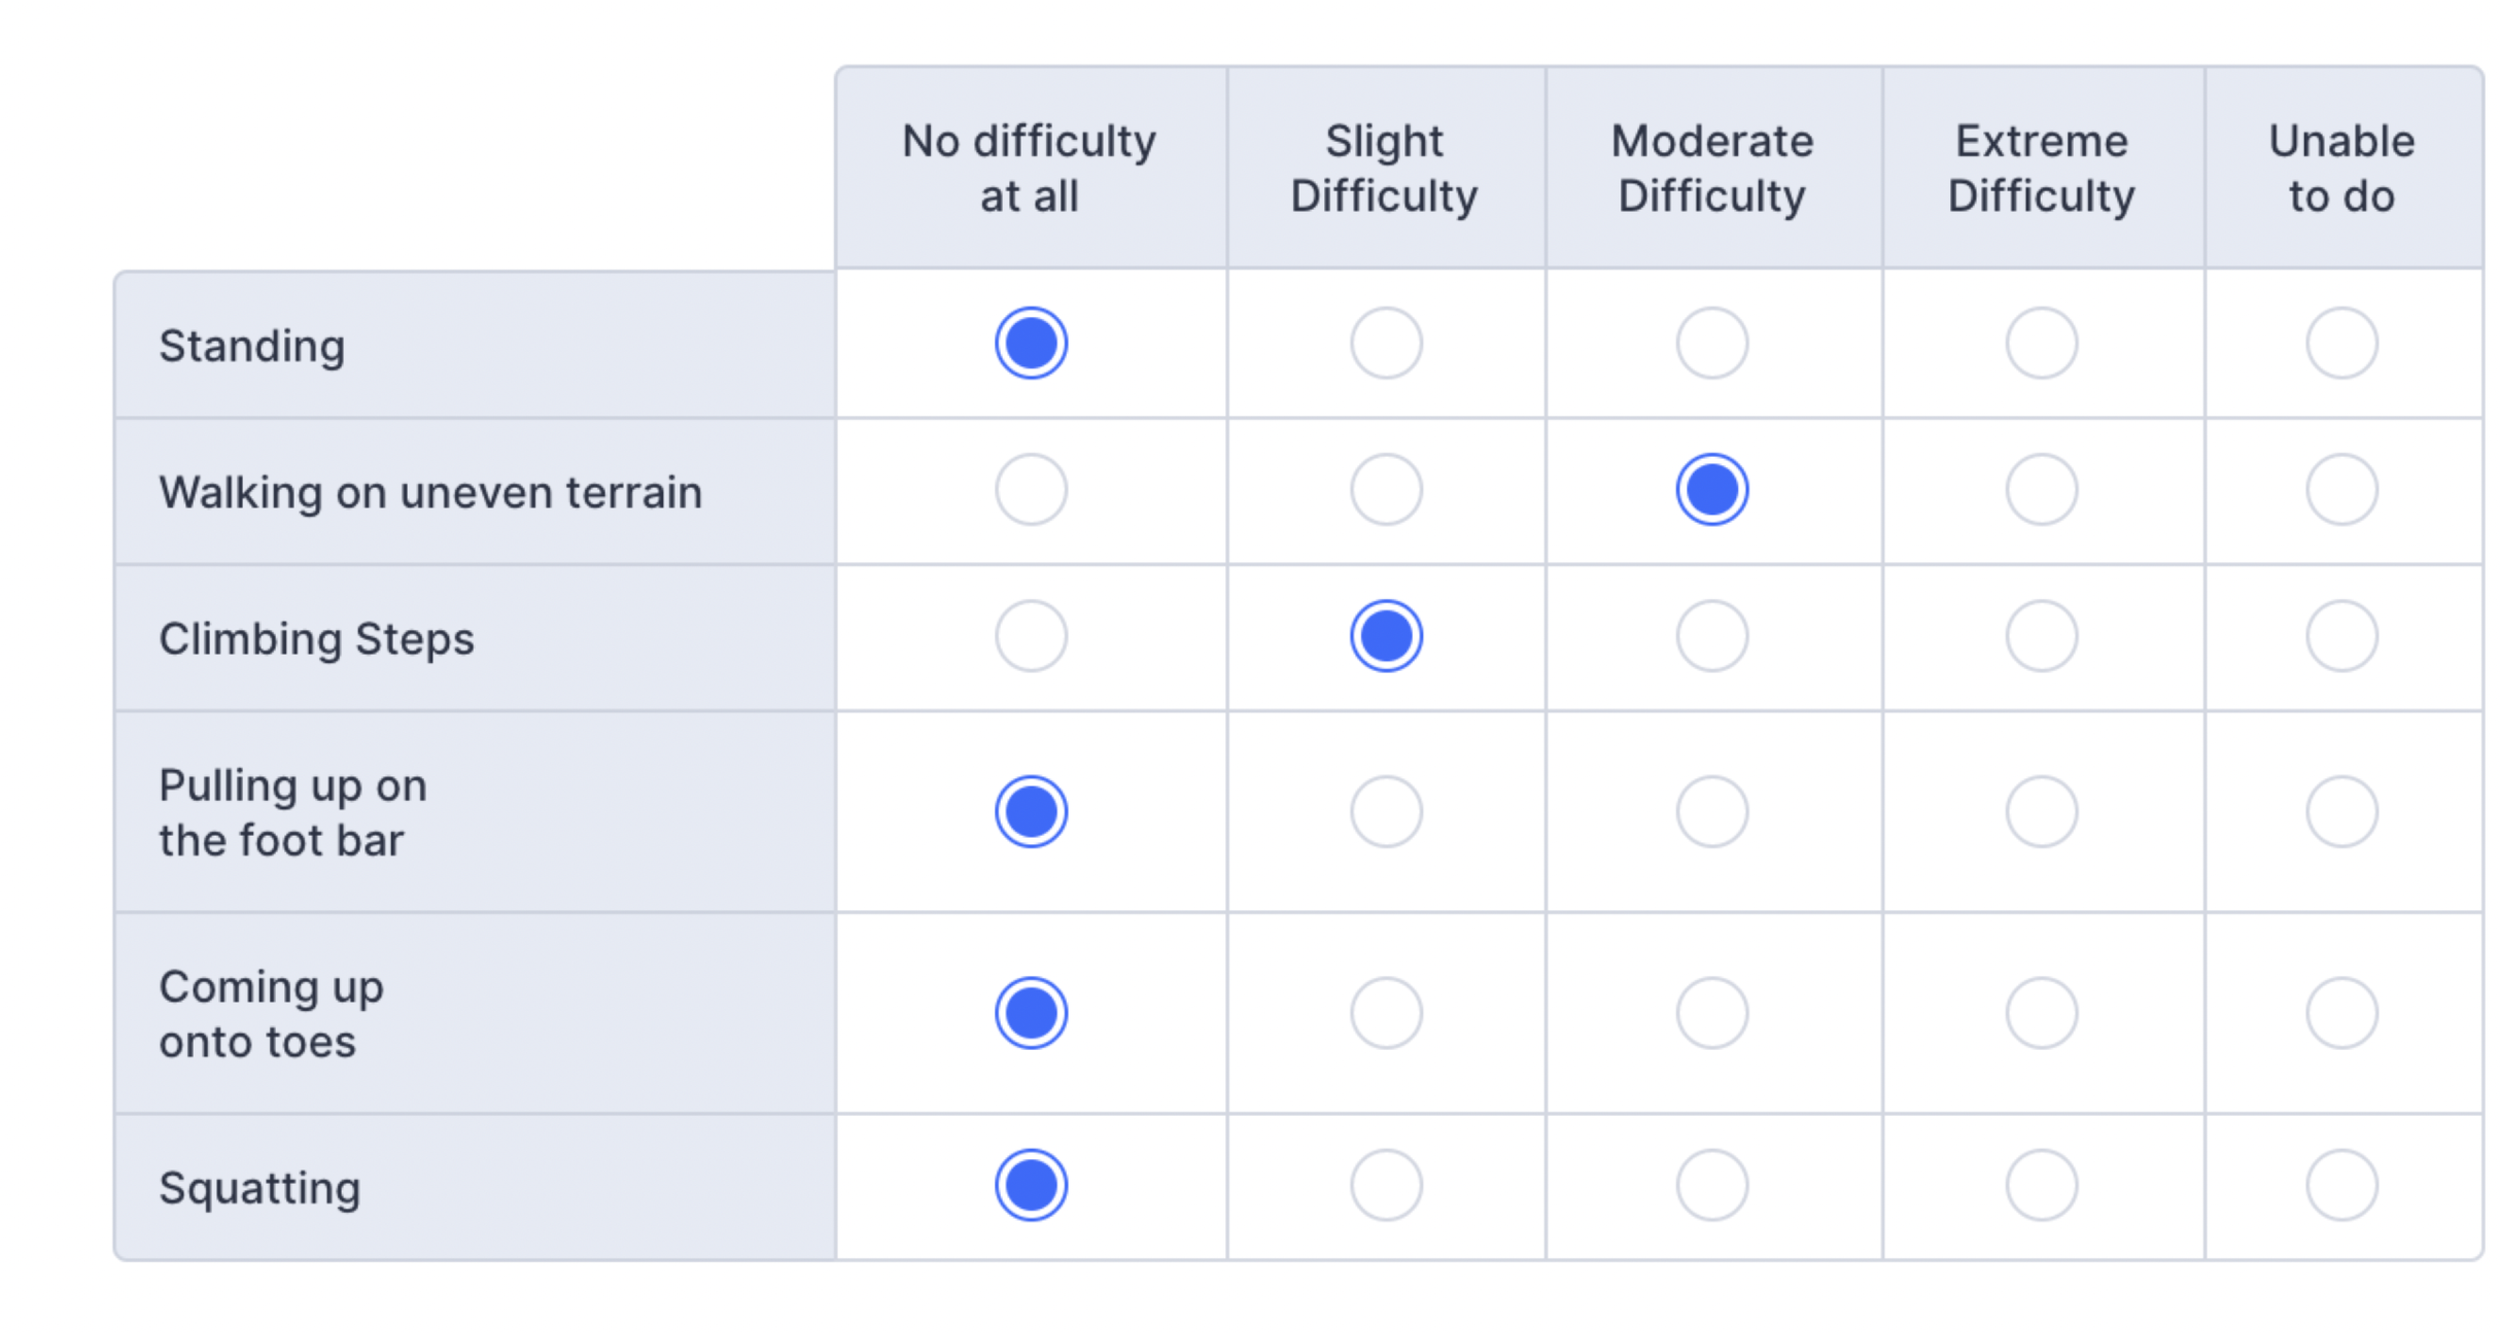
We discovered from testing our current survey that while people struggle to identify injury sites precisely, they can identify the rank and shape of pressure. We also discovered that, compared to standing or walking, people typically find it harder to pull up on the foot bar and stand on their toes.
Our solution must be safe to use and capable of determining the location and intensity of the pressure. Additionally, it should be undetectable by the user, take less than ten minutes to use, and be evaluated. Last but not least, it will be vulnerable to stretching brought on by putting on and taking off the space suit, as well as from contact with other space suit parts.
Prototype Development
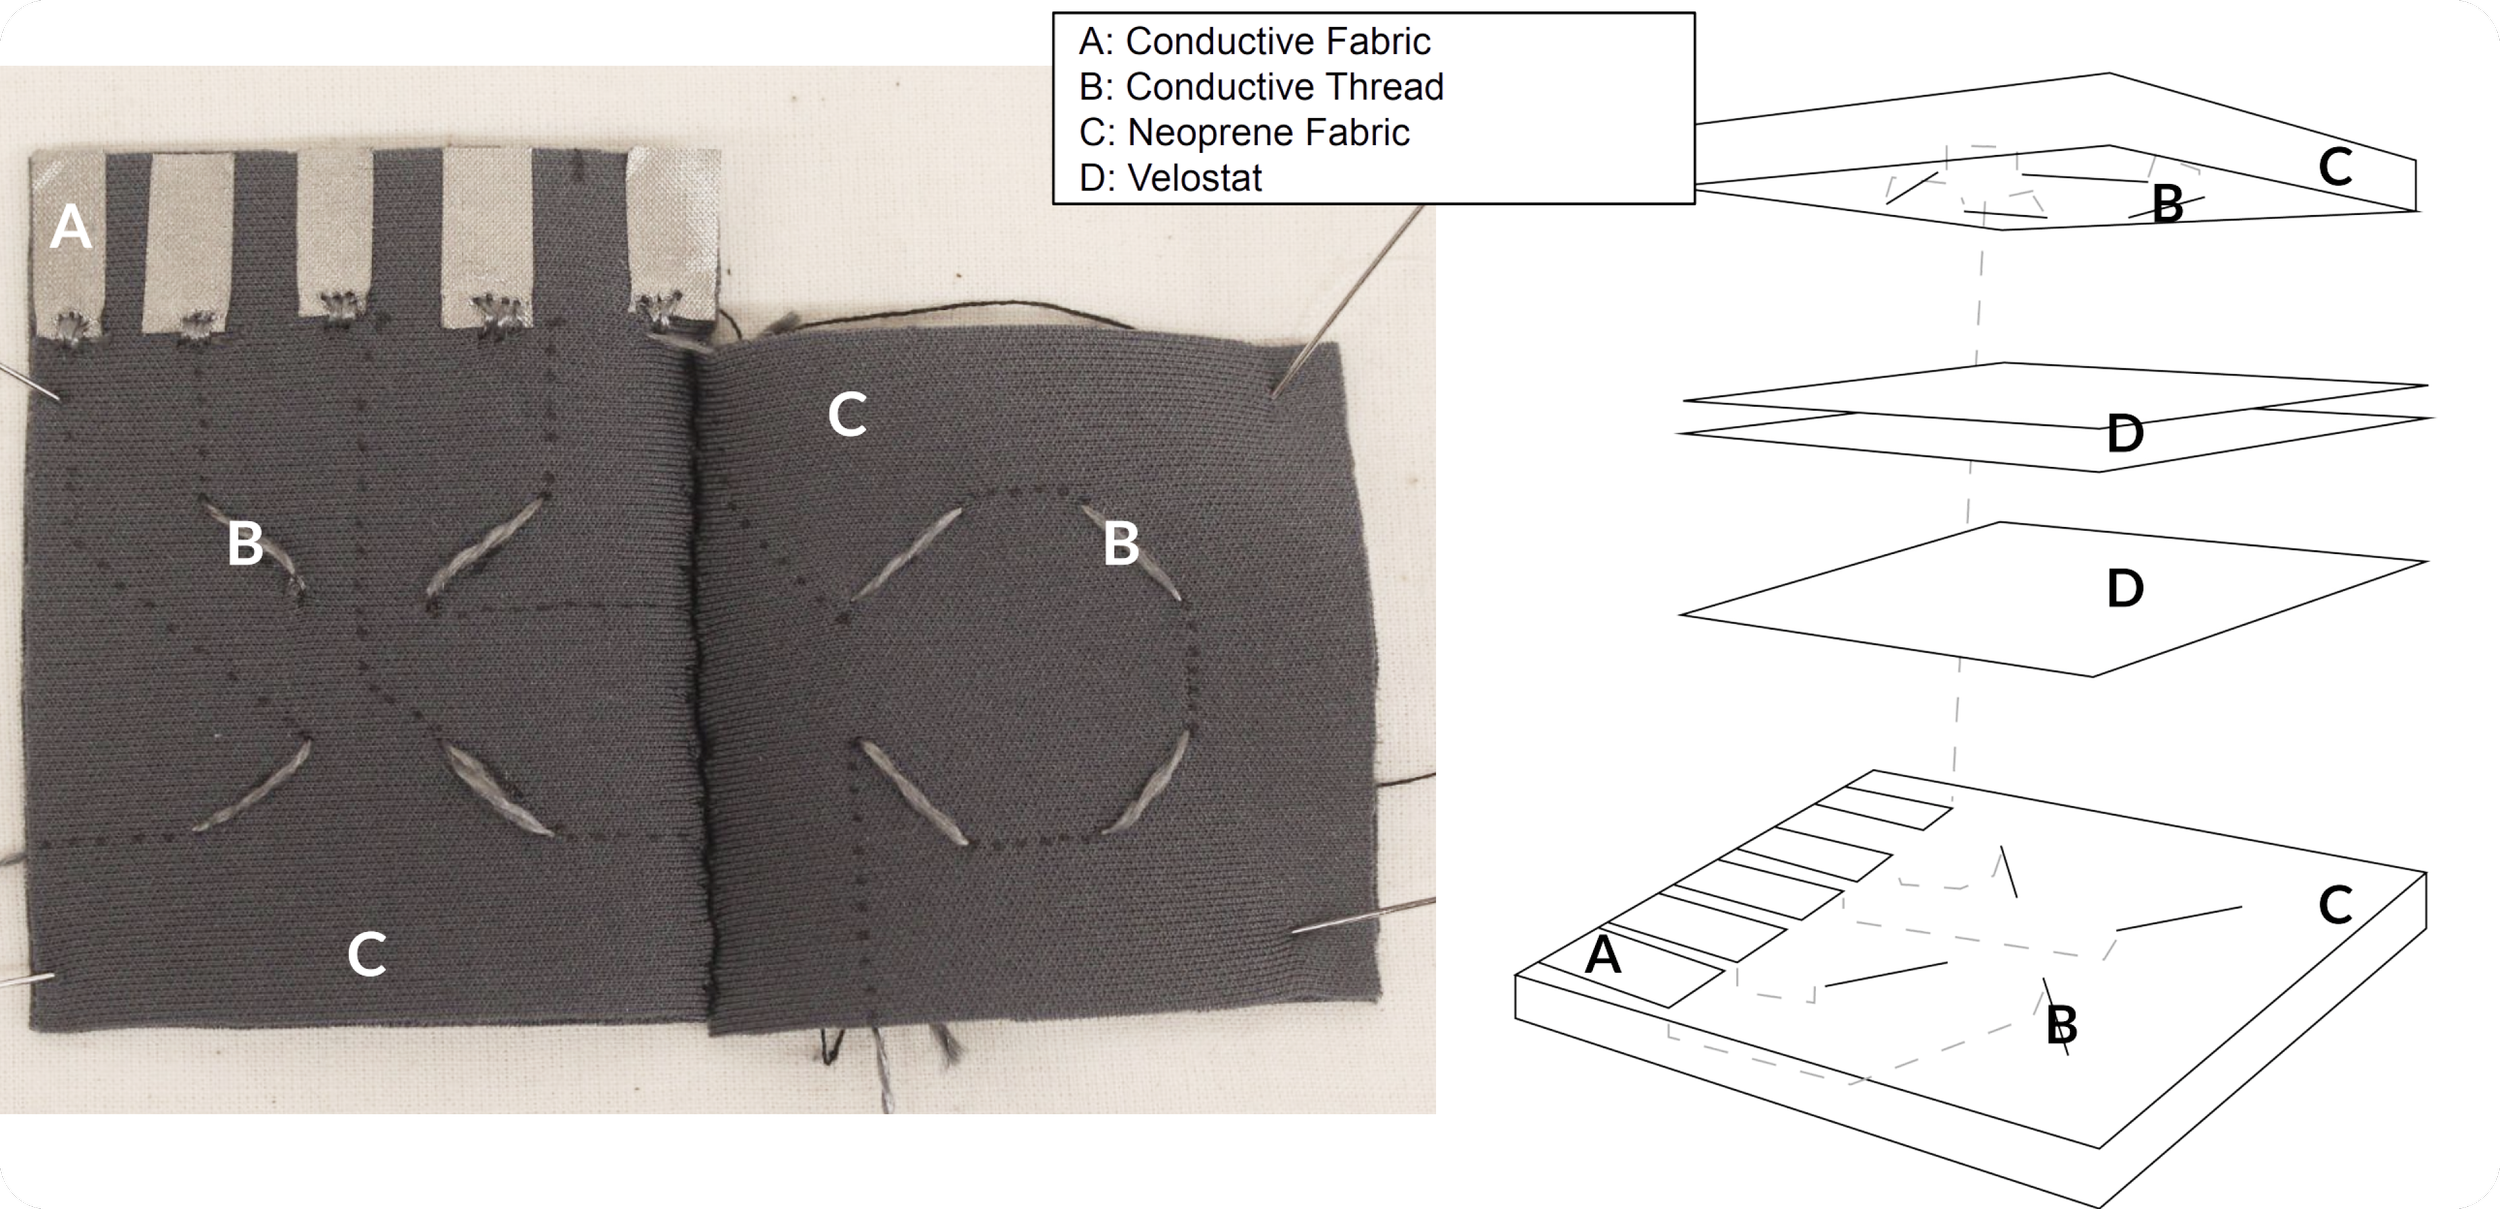
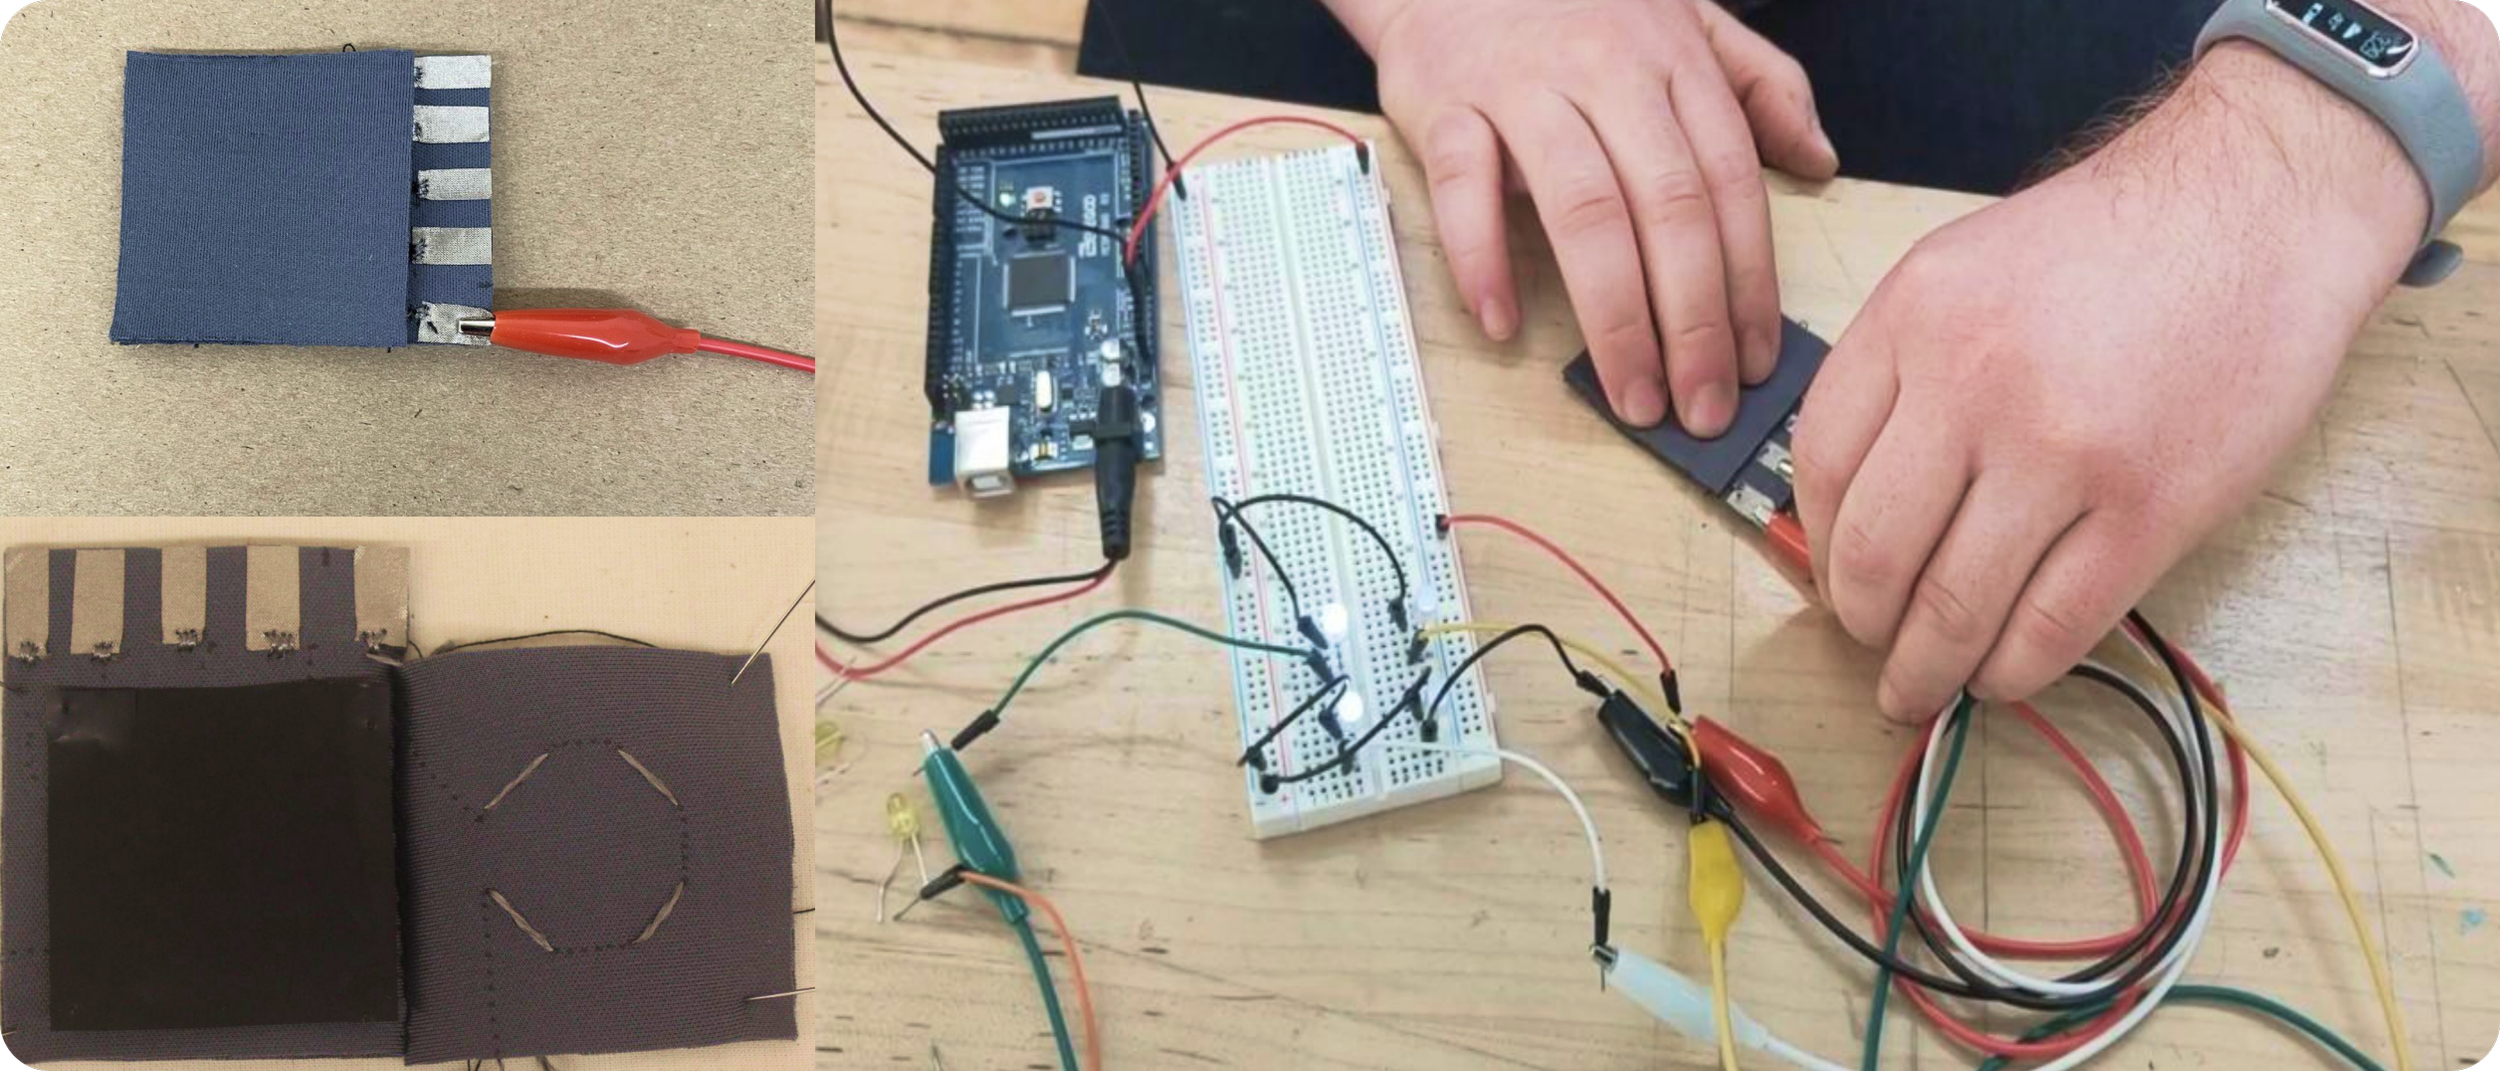
We discovered this technique of using conductive thread with neoprene after conducting numerous tests with conductive fabric and velostat. We then tested a small sensor to see if it would work. Here is a demonstration of a 2x2 grid of these fabric sensors coupled with LEDs that glow brighter where pressure is being applied.
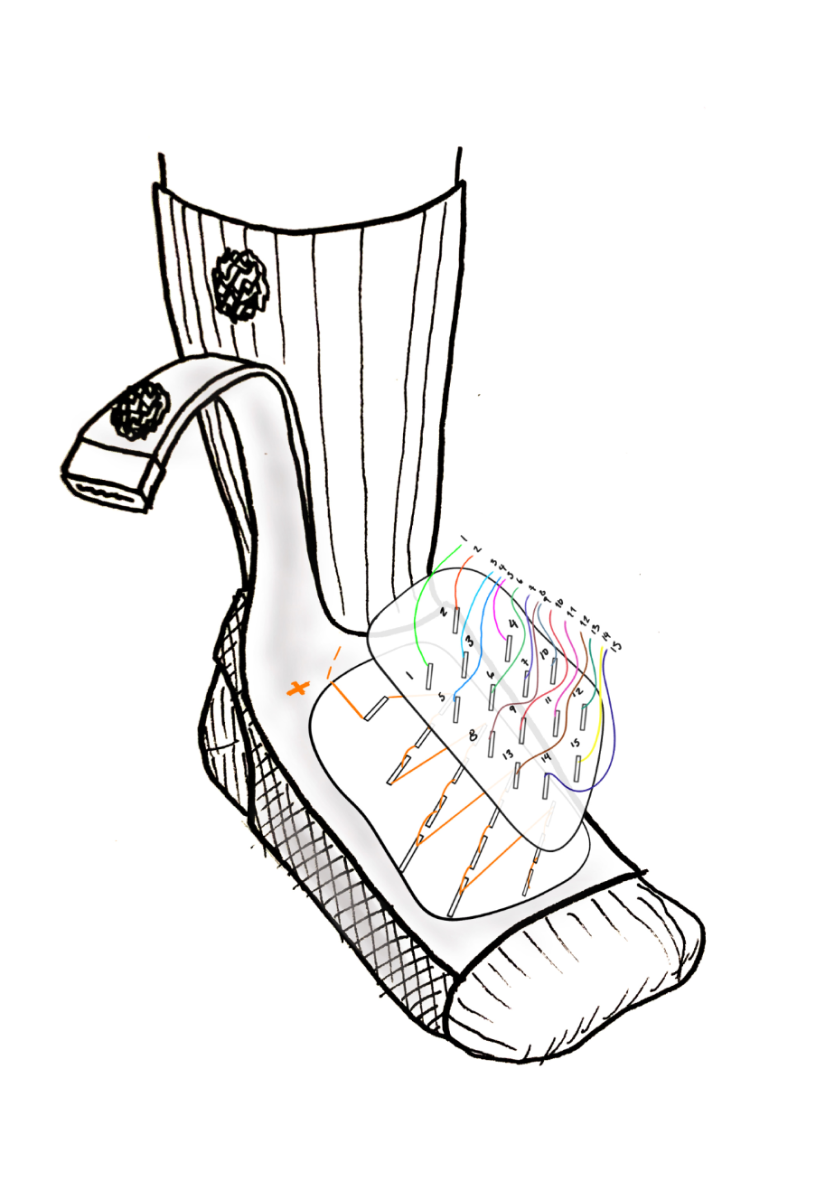
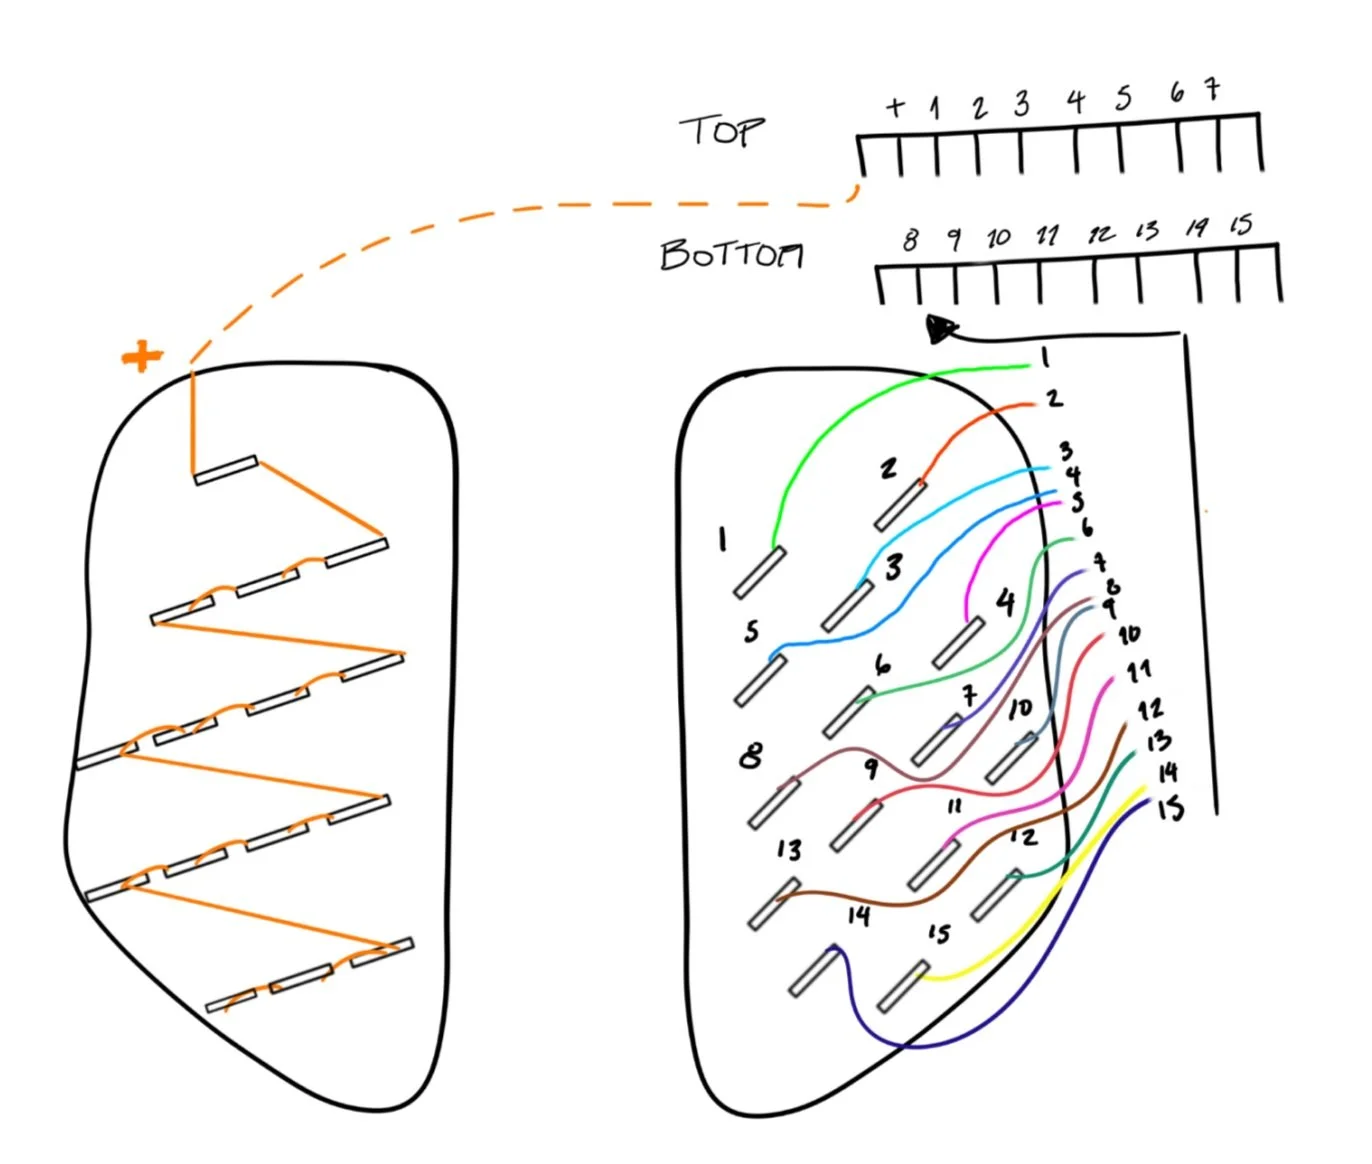
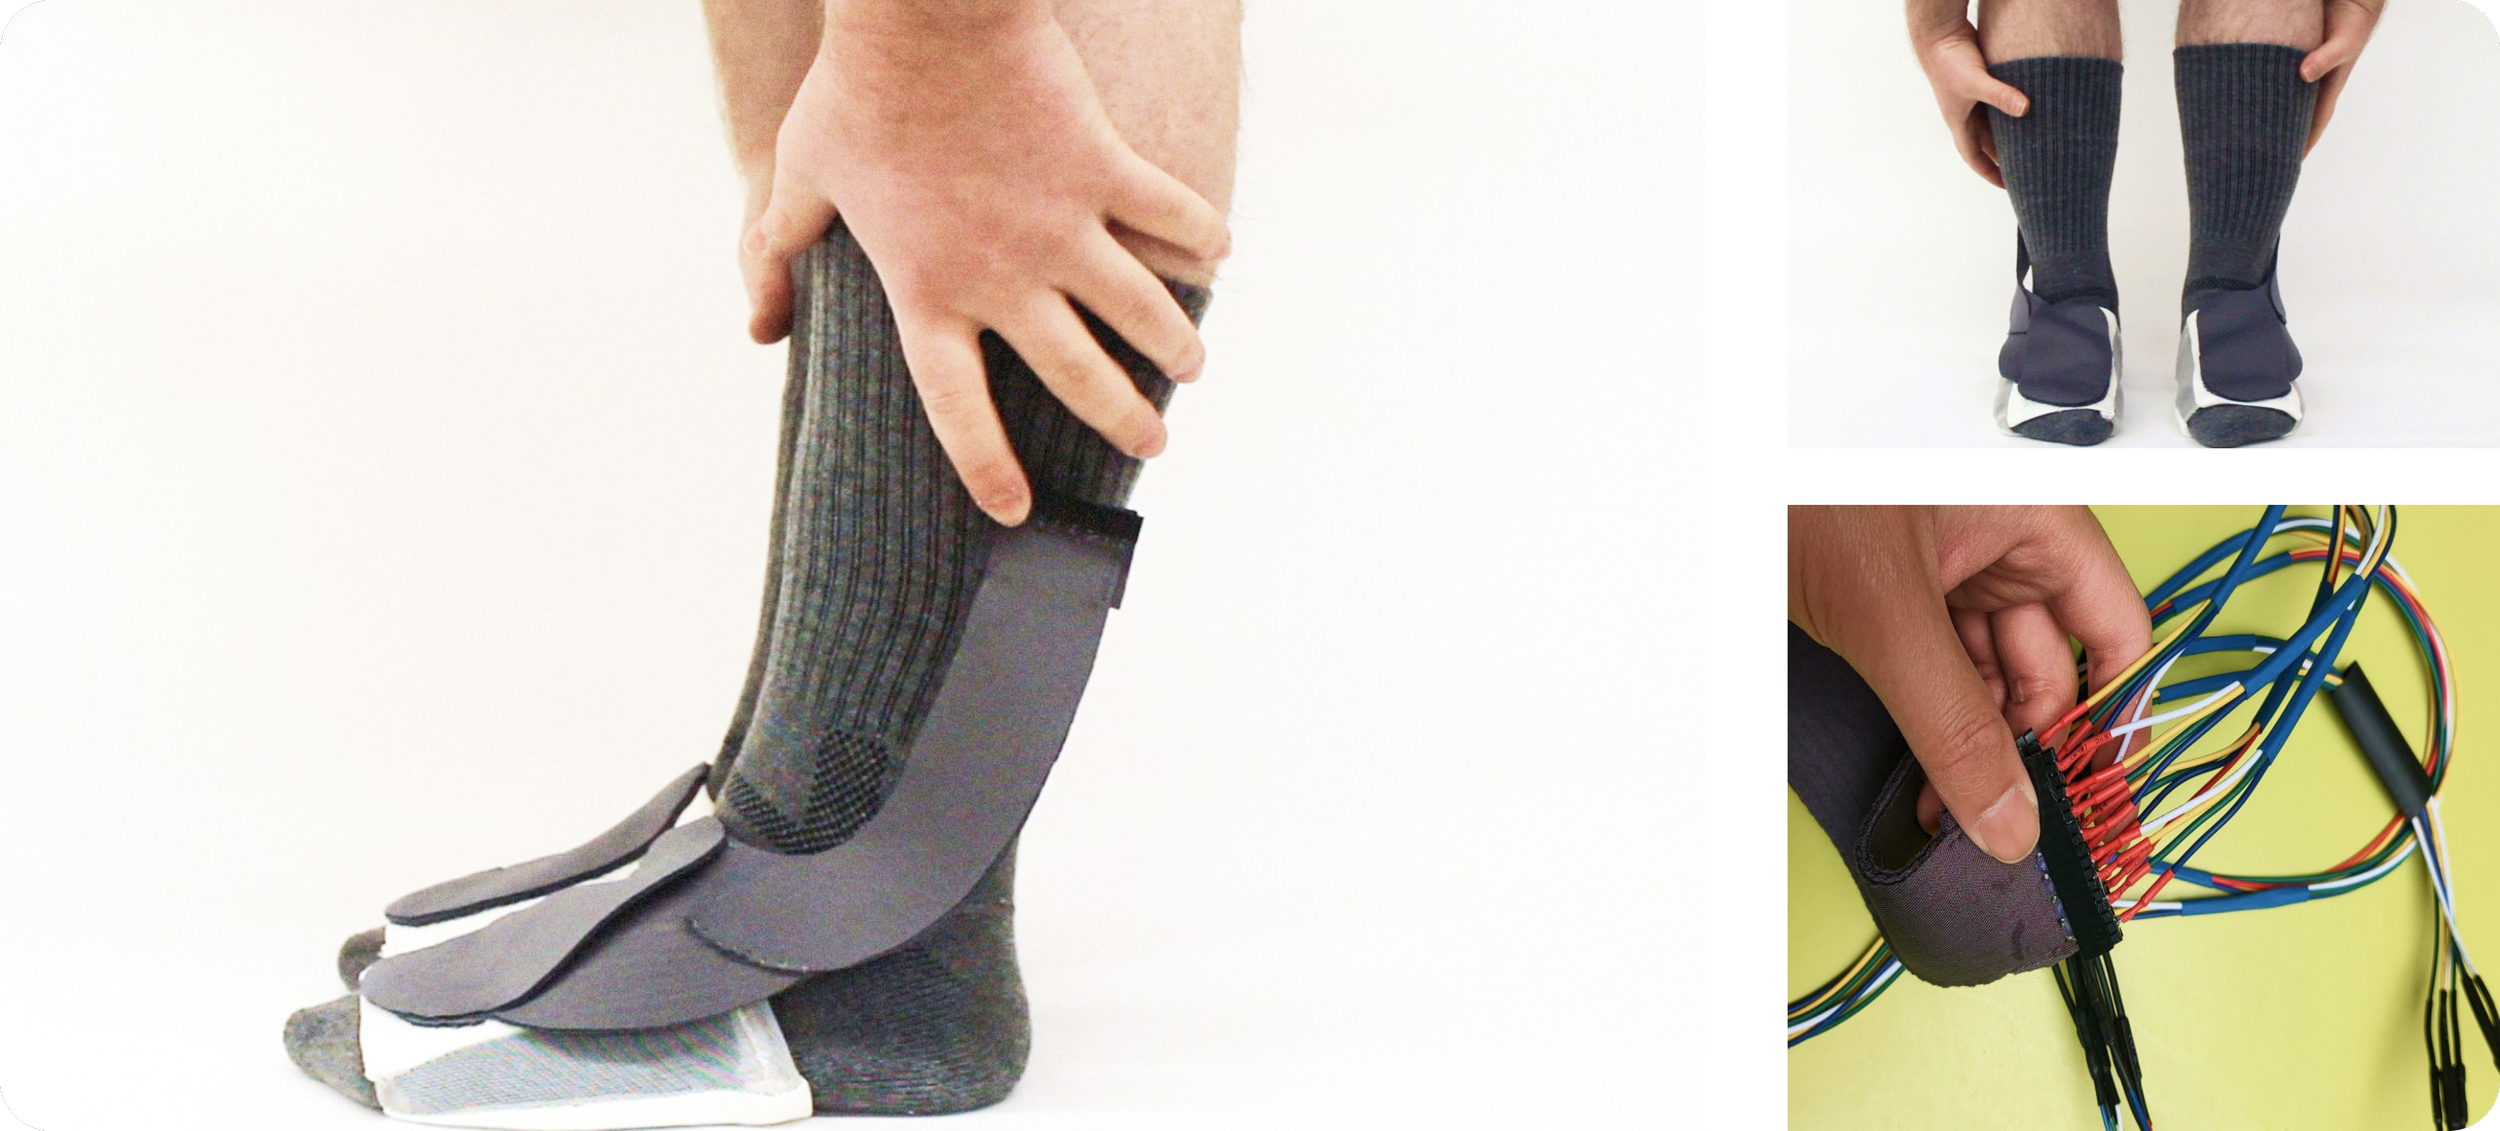
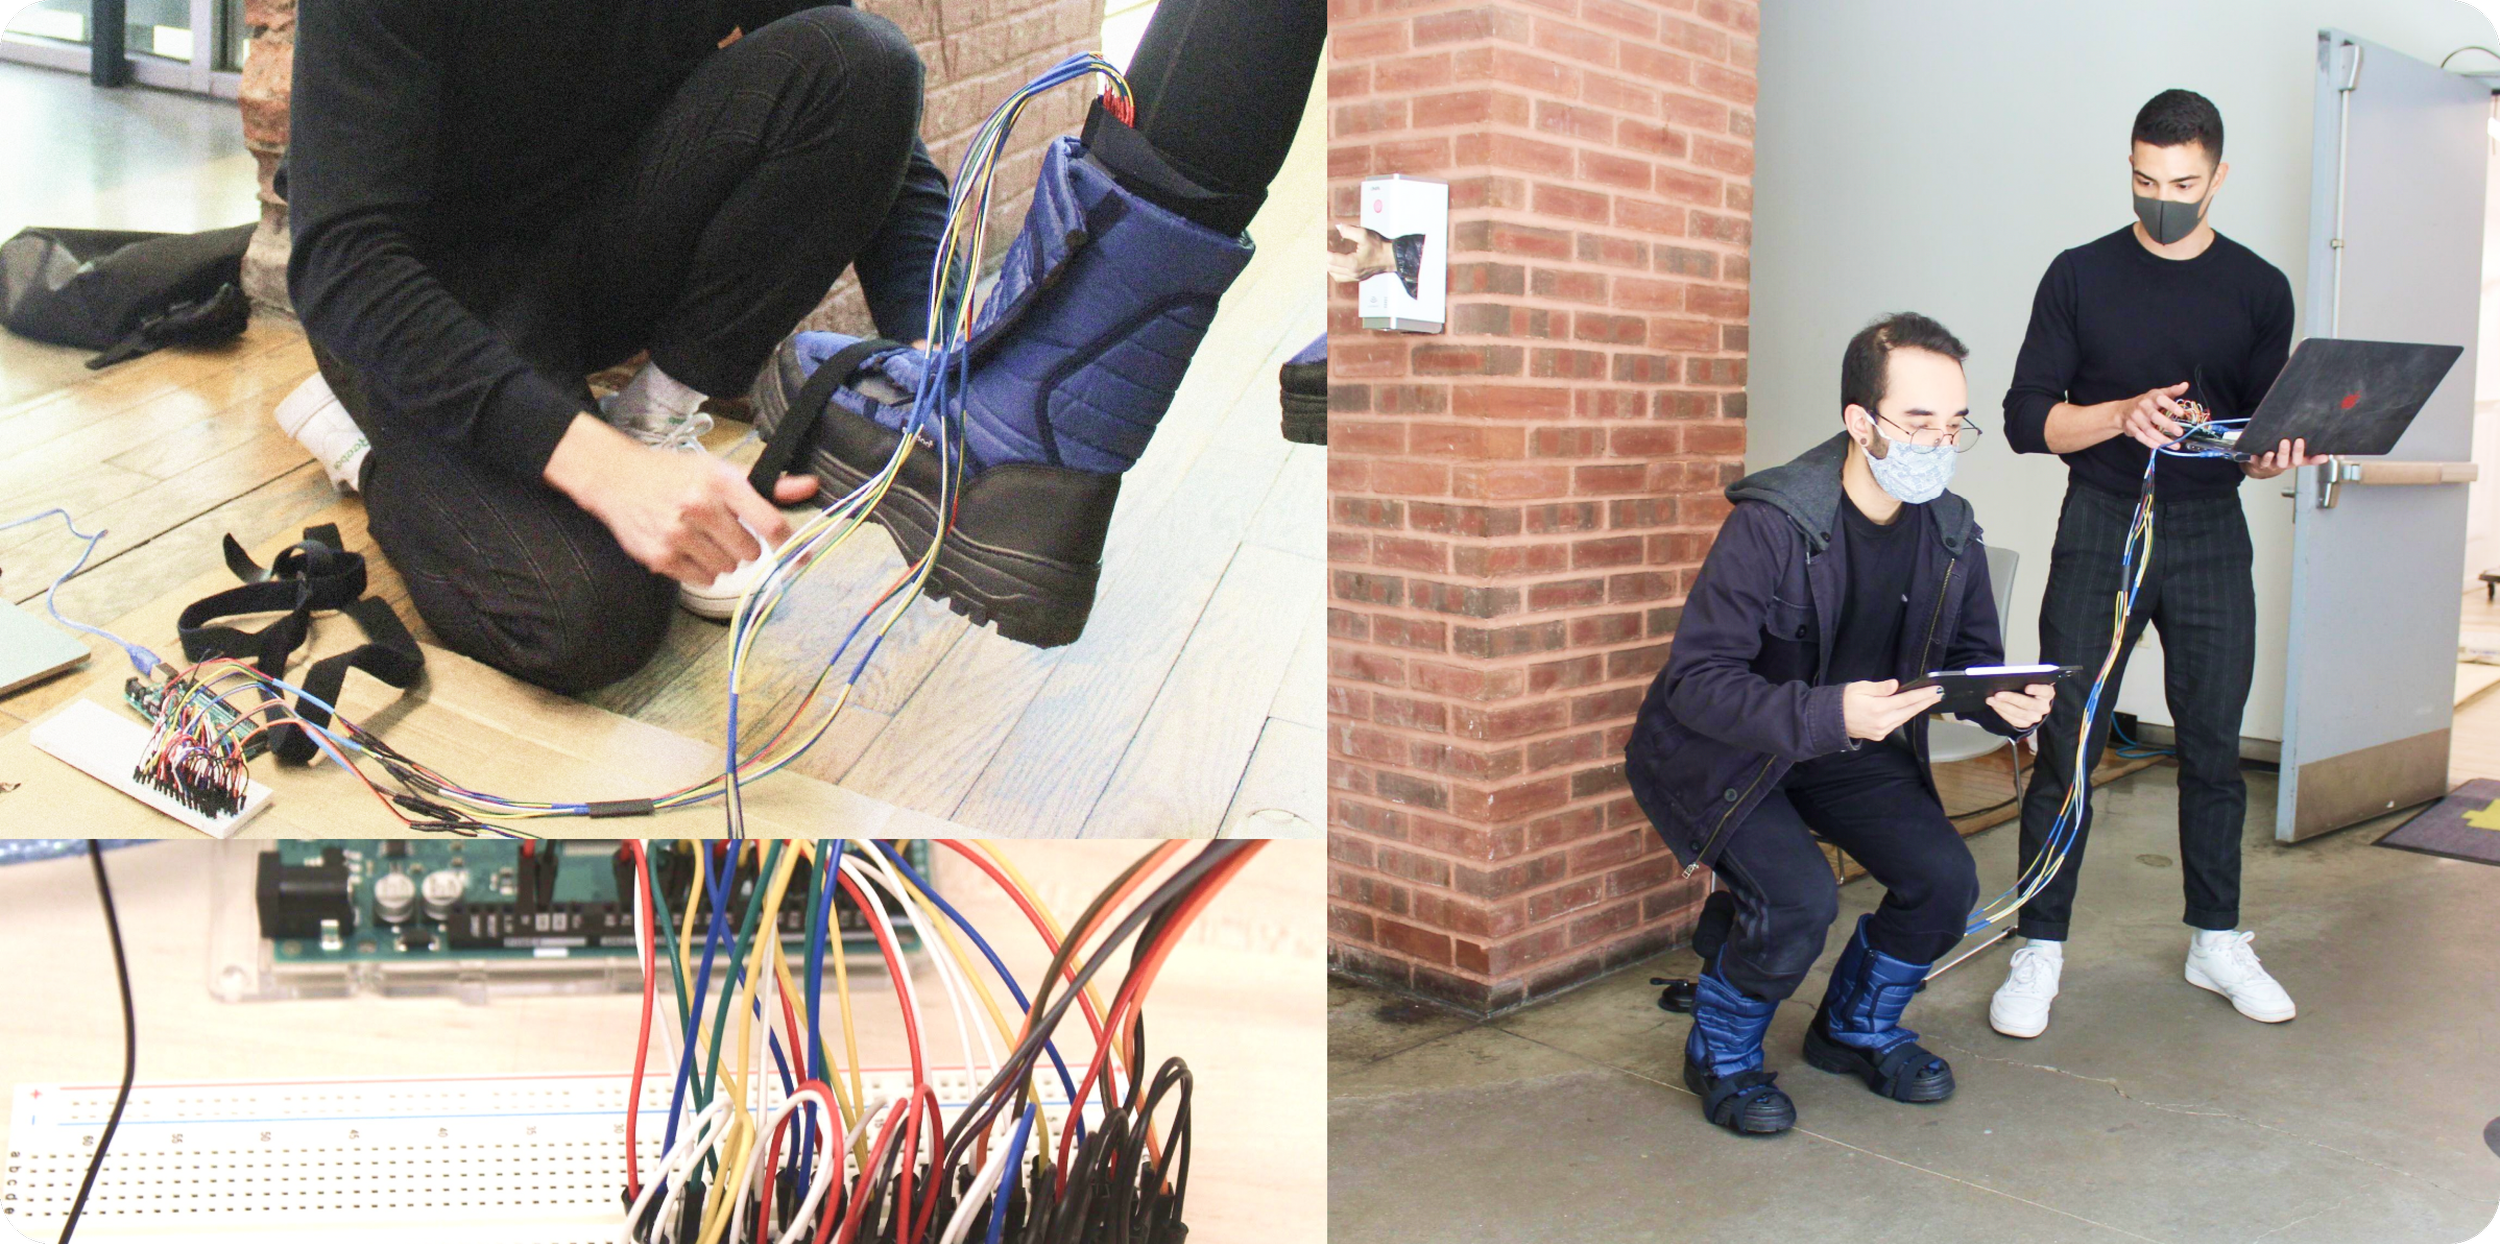
We created a garment for the dorsum of the foot after testing this approach and finding it to be effective. The final sensor garment, as seen in the images, has an array of 15 sensor outputs that are connected by fabric ribbon cables to threads that extend up to the calf in two layers of neoprene.
Making the sensor
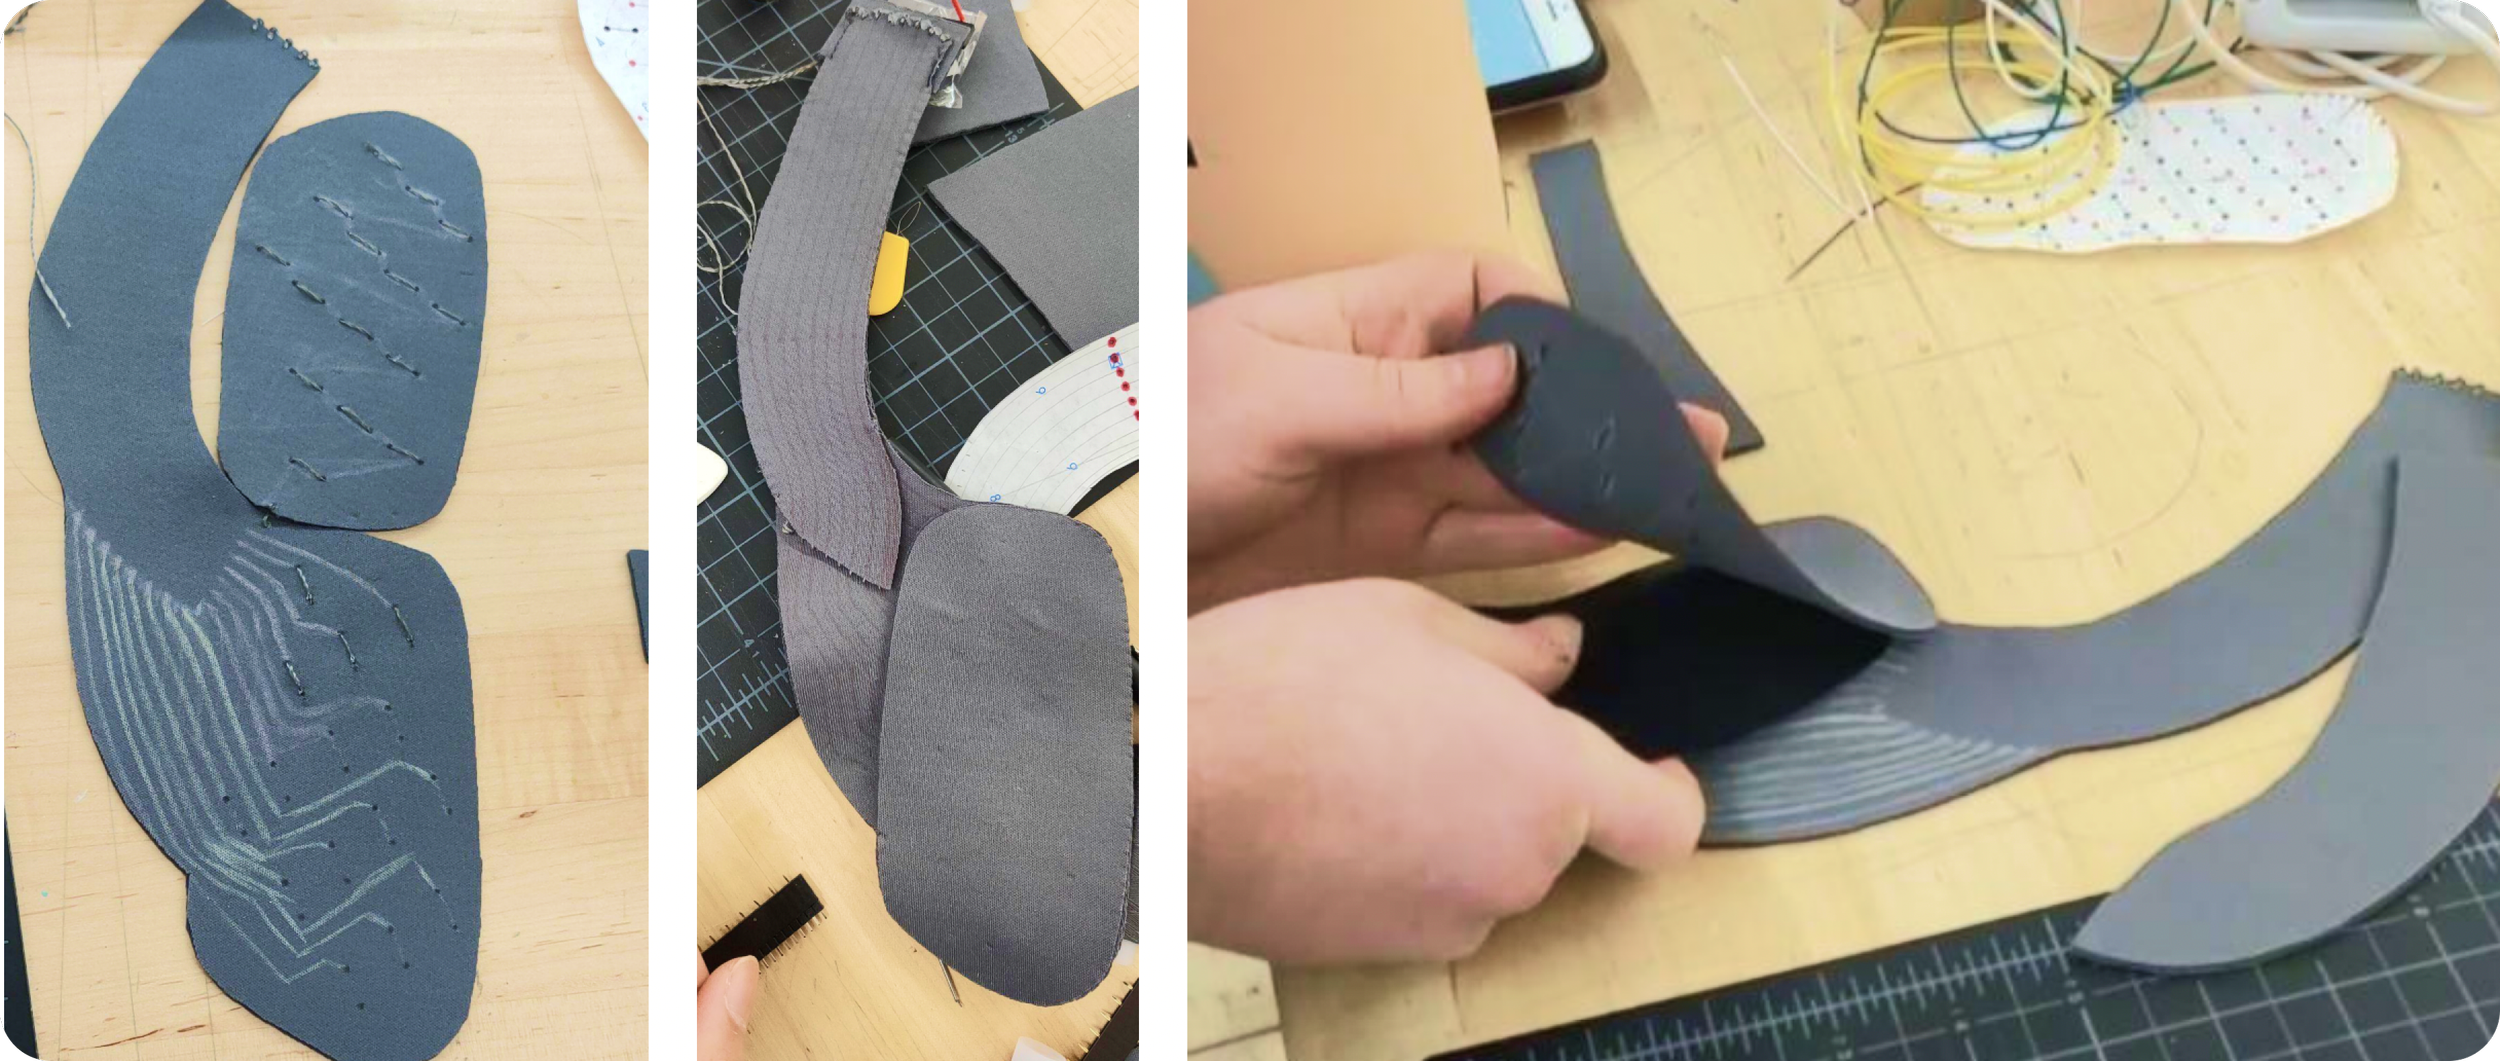
Here is a picture of the sensor and the conductive thread inside. The thread's path inside the neoprene is marked by the chalk lines. Neoprene is made of two layers of fabric connected by a spacer. We were able to sew between the two layers of neoprene, which insulates the conductive thread.
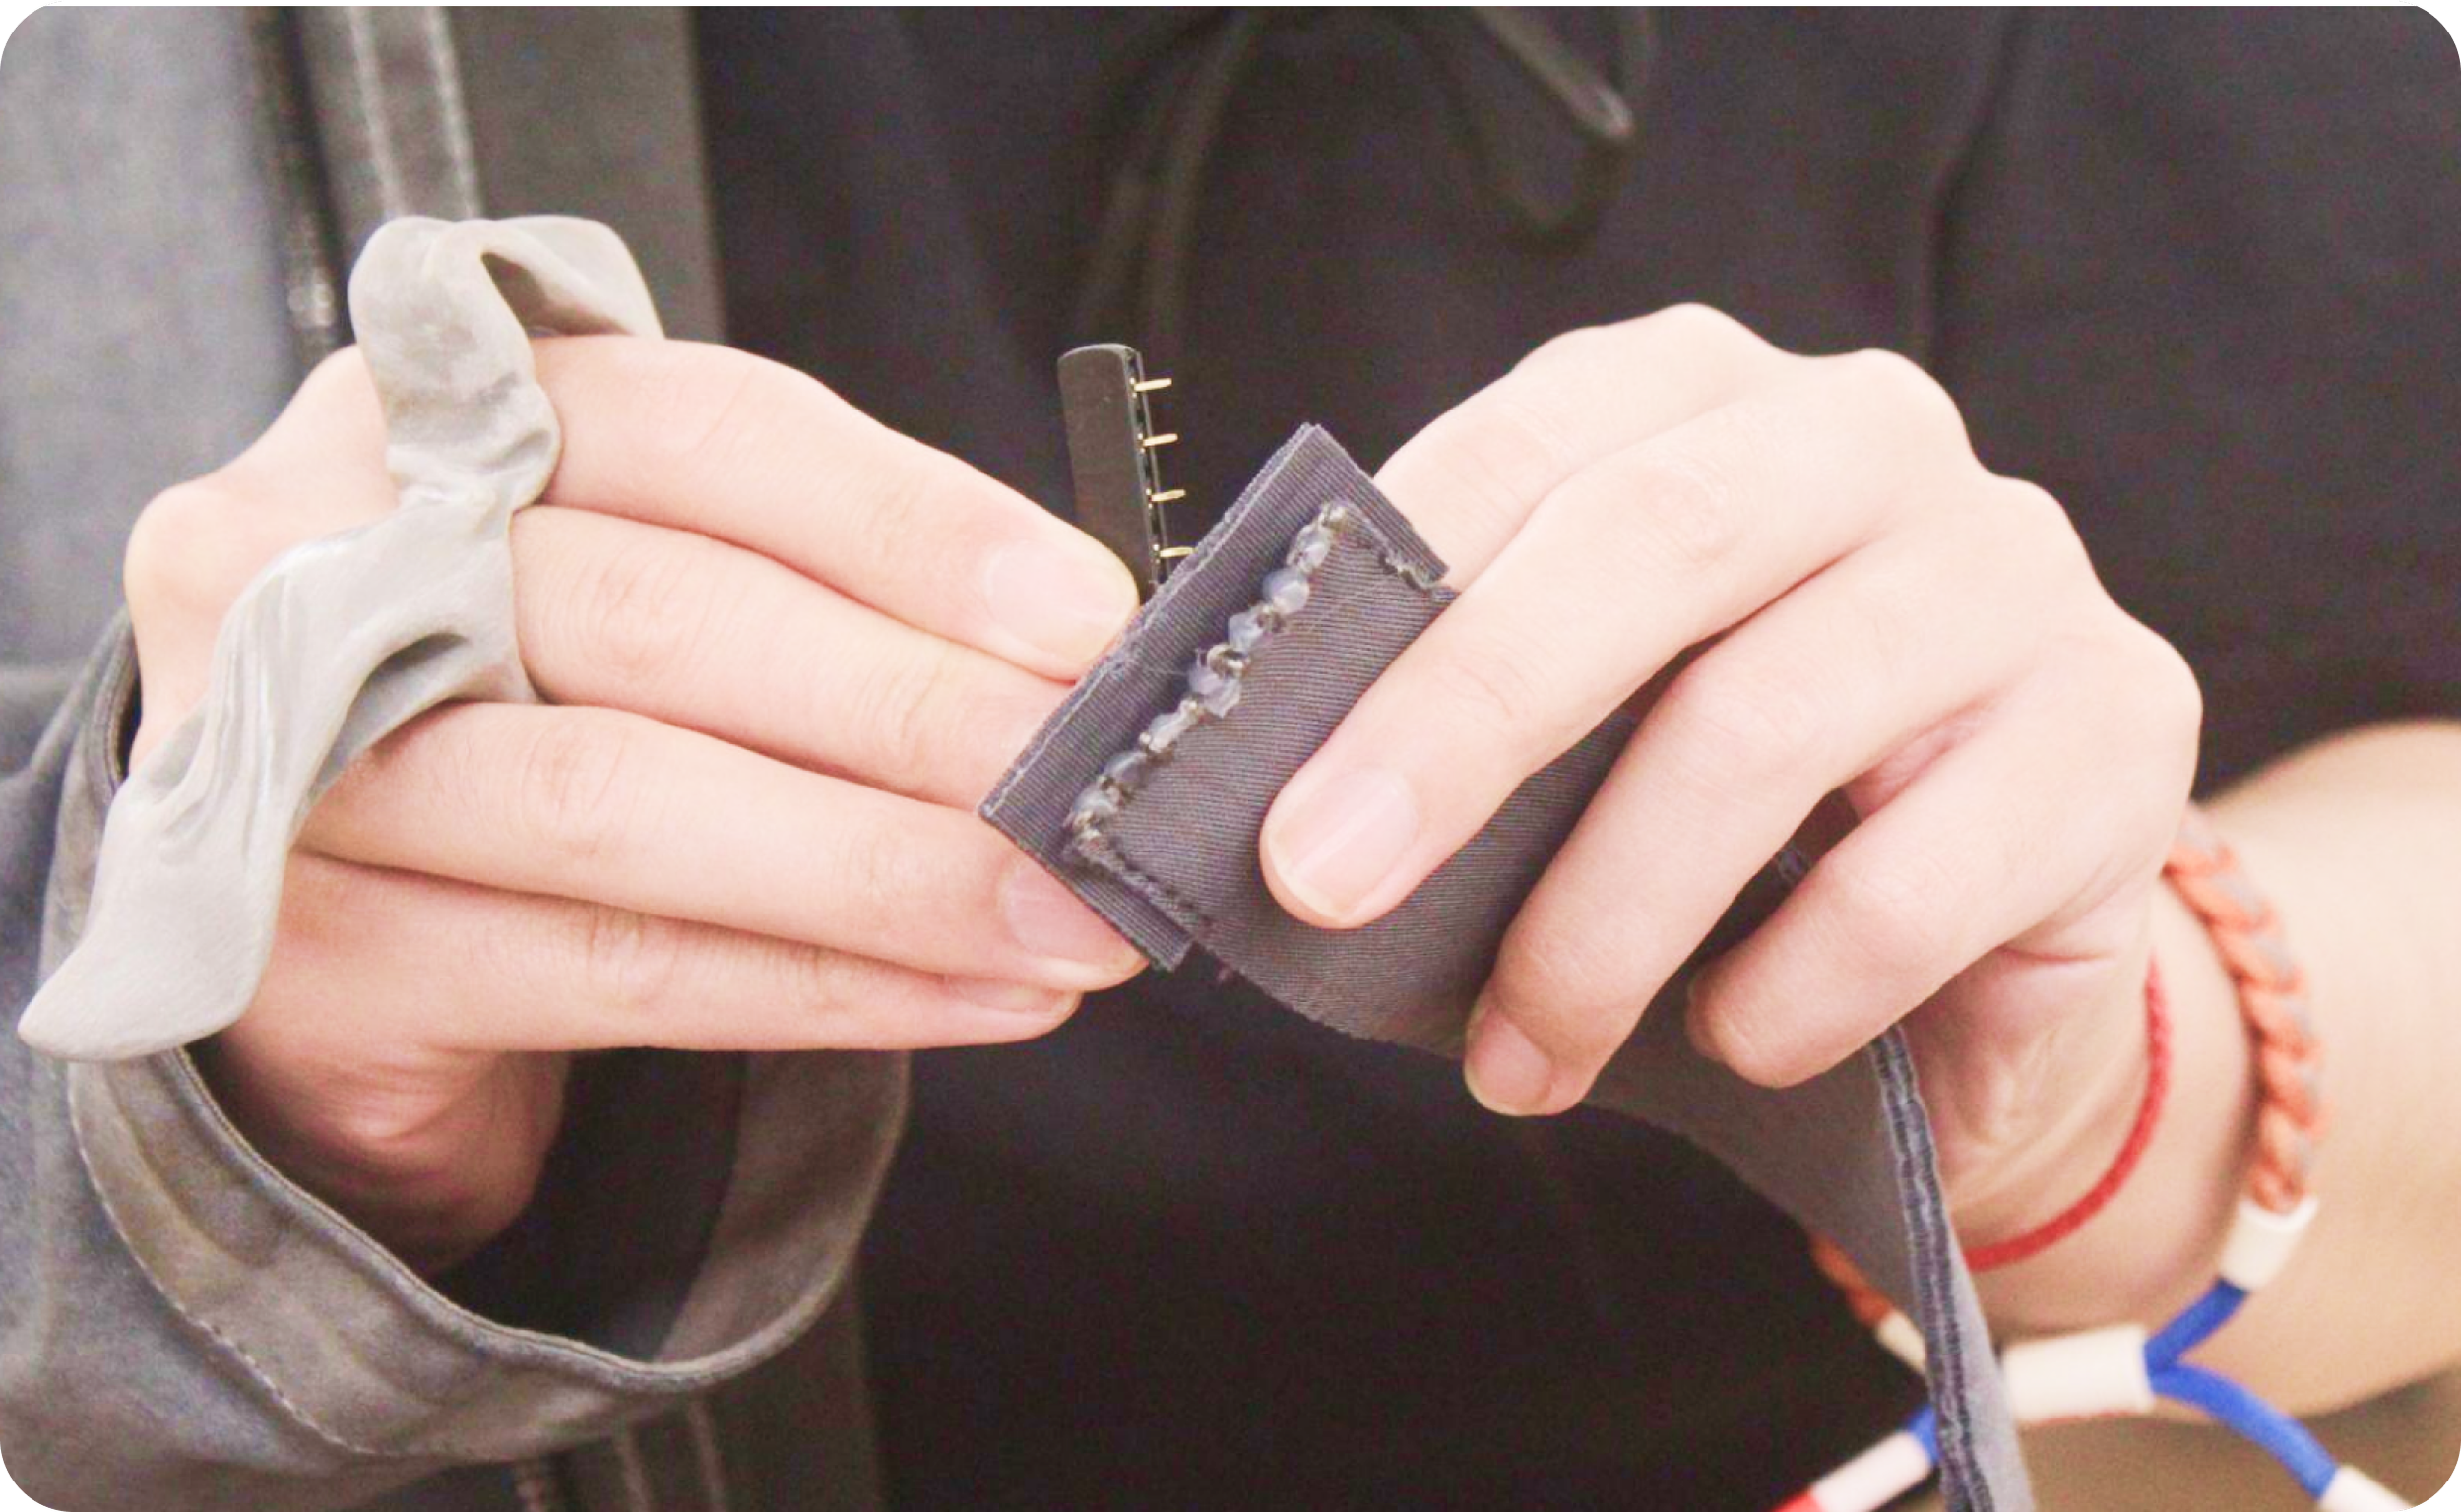
The conductive thread loops that the fabric ribbon cables terminated in could be plugged into with conventional male headers and wires to connect them to the arduino boards. We then hooked female headers into these loops. We added an insulating material in between the leads because of their close proximity in order to prevent interference.
UX evaluation of the finished product
We cut the side of the boot to make it simpler to put on and take off the boot while the sensor is attached. To achieve a more adjustable fit, we later sewed velcro to the cut sides. Then, to create the discomfort required to test our survey and sensor, we sewed buttons onto pieces of velcro that we can arrange inside the boot as needed.
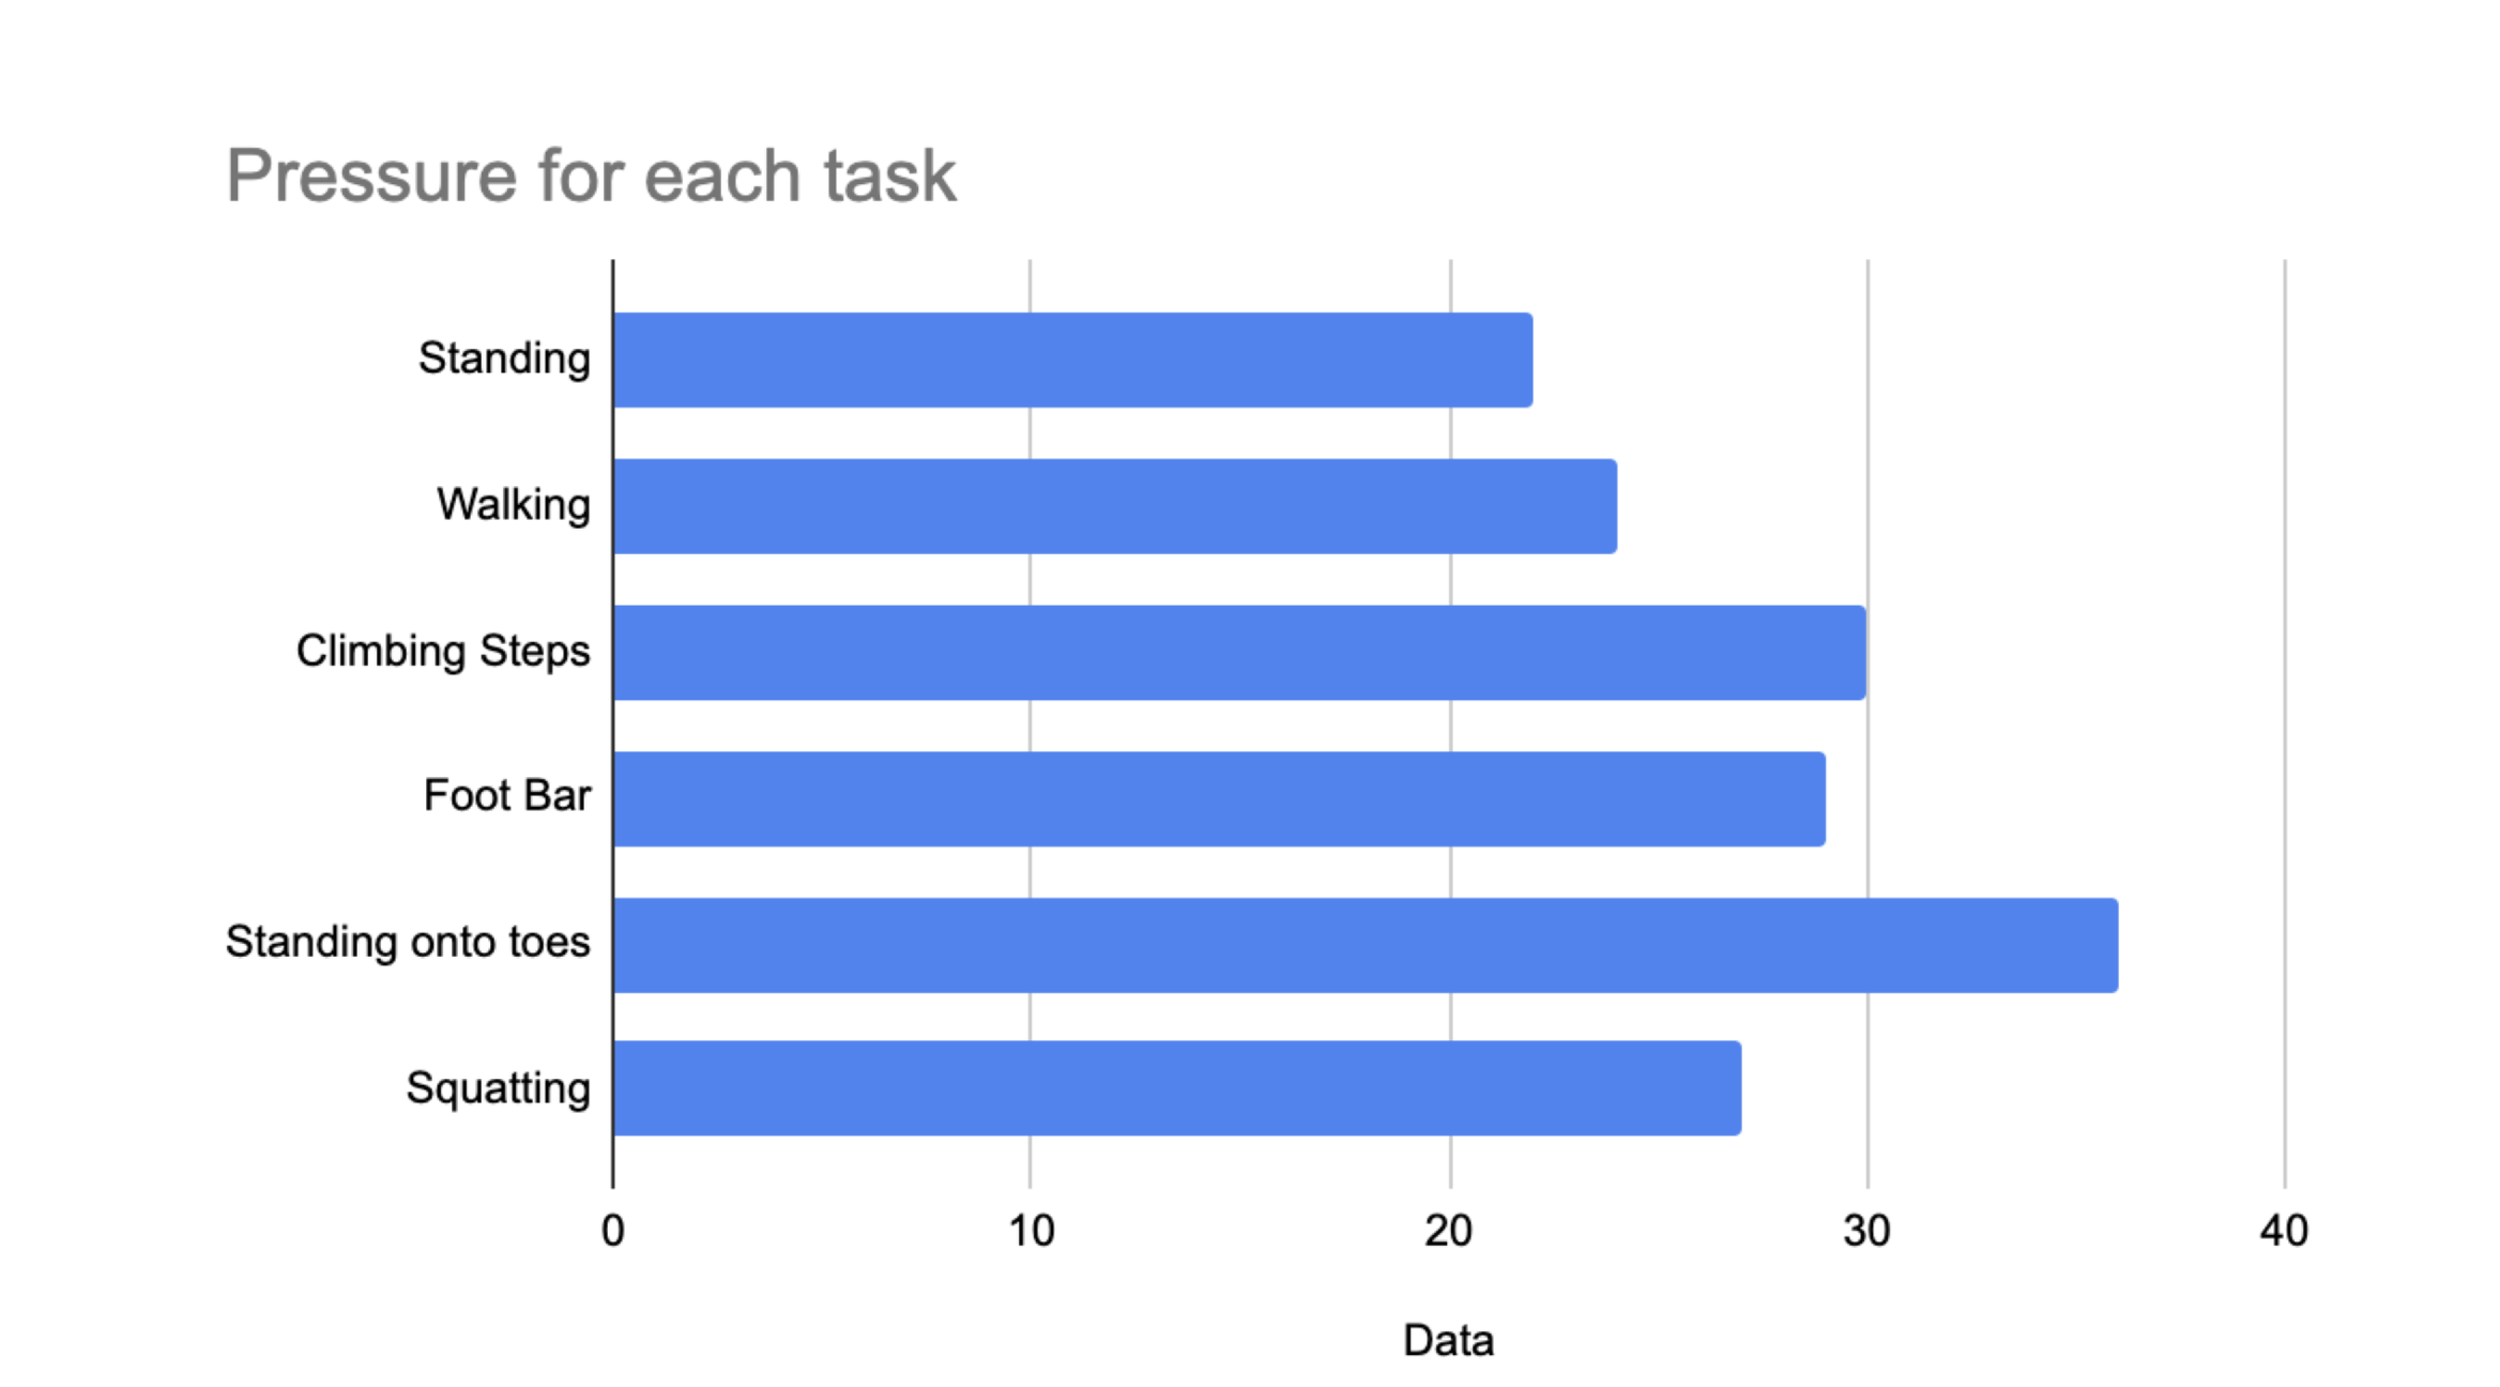
In order to gather data on fit while moving, we then gave participants 6 tasks to complete, including standing, walking on uneven ground, climbing steps, pulling up on a foot bar, standing on their toes, and squatting.
The idea was to create terrain that looked like Mars' surface.
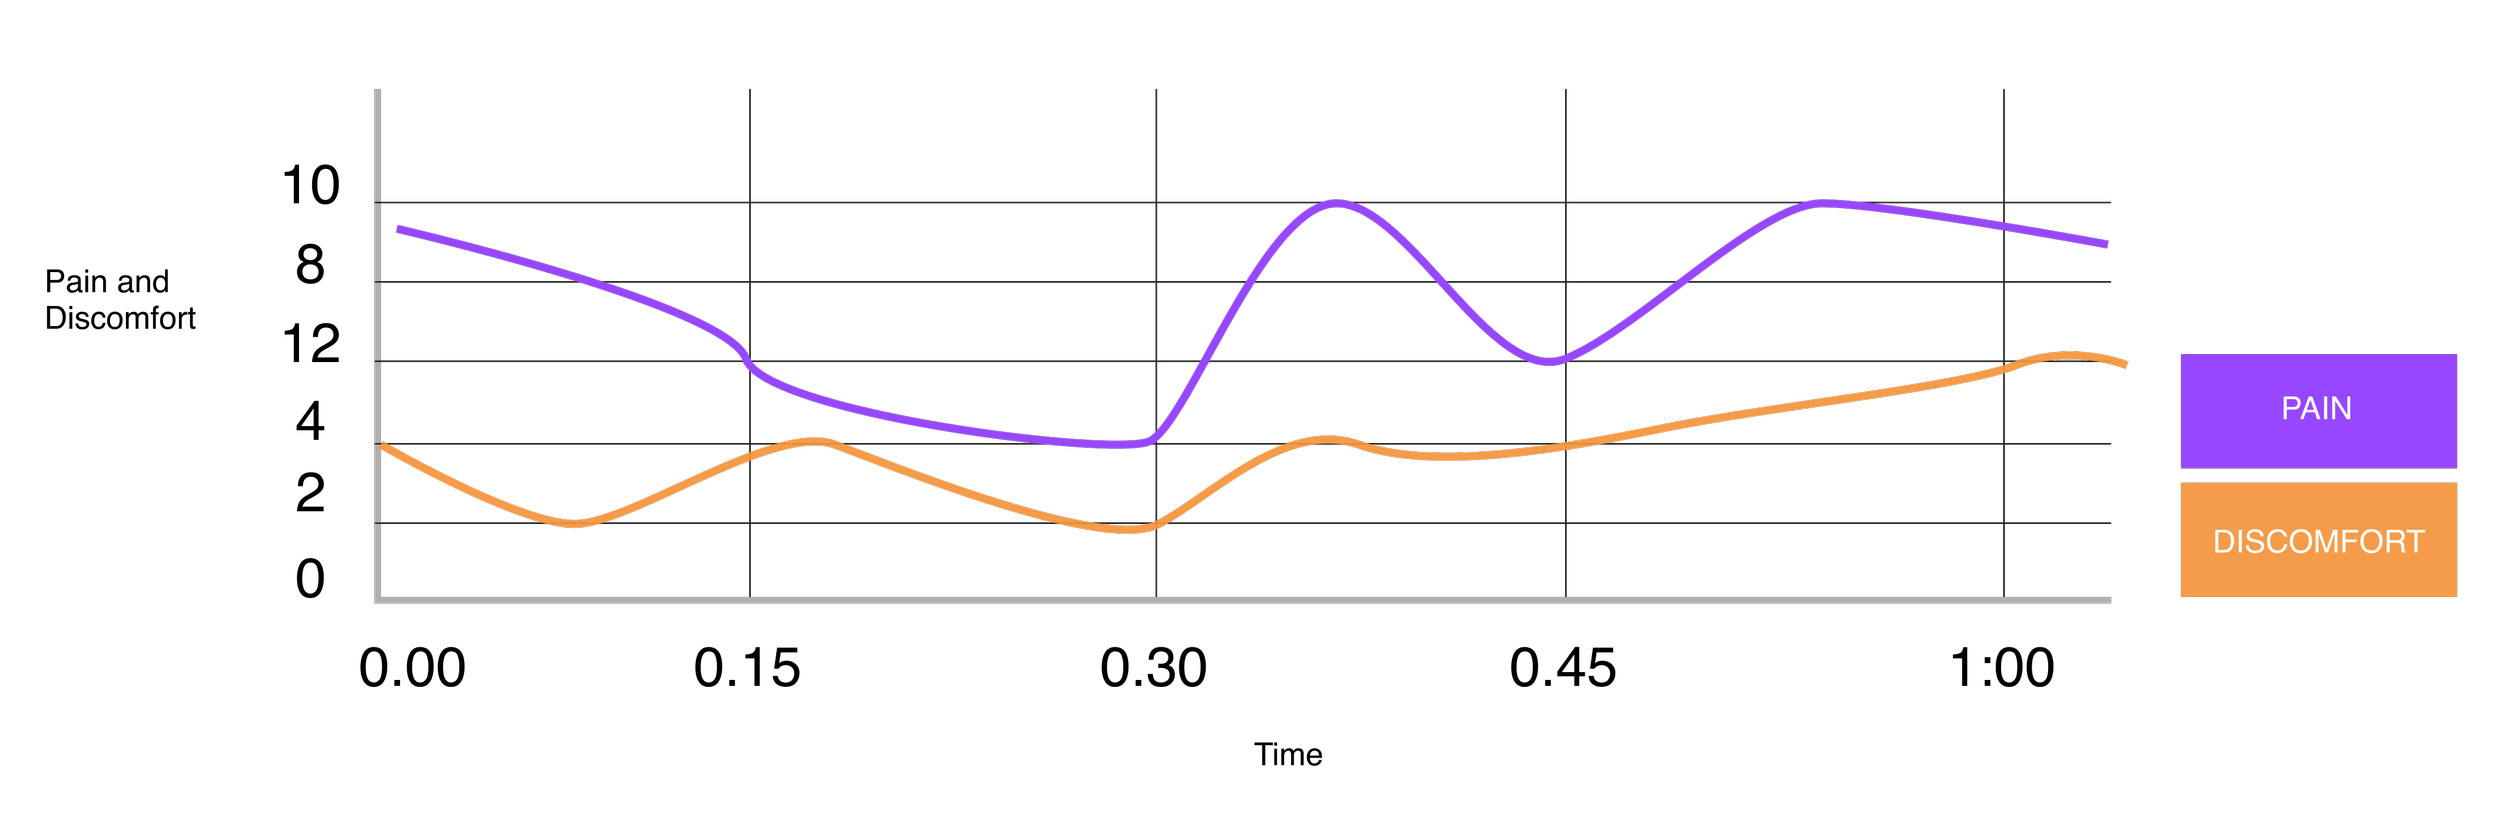
We timed when each participant completed the aforementioned tasks in order to analyze the data. For instance, from seconds 0 to 8 would involve walking, from seconds 8 to 16 would involve climbing stairs, and so on. We would then connect the point in those tasks when the sensors tested the most pressure.
The colored lines, as seen in the video, represent the pressure that is present as the participant realizes the aforementioned actions. When walking on uneven ground or holding onto the foot bar, for instance, the black line represents the continuous amount of pressure being applied, whereas the differentiation on the peaks represents the pressure being applied to the sensor when one is poked or when there is too much friction when one squats or stands on one's toes.
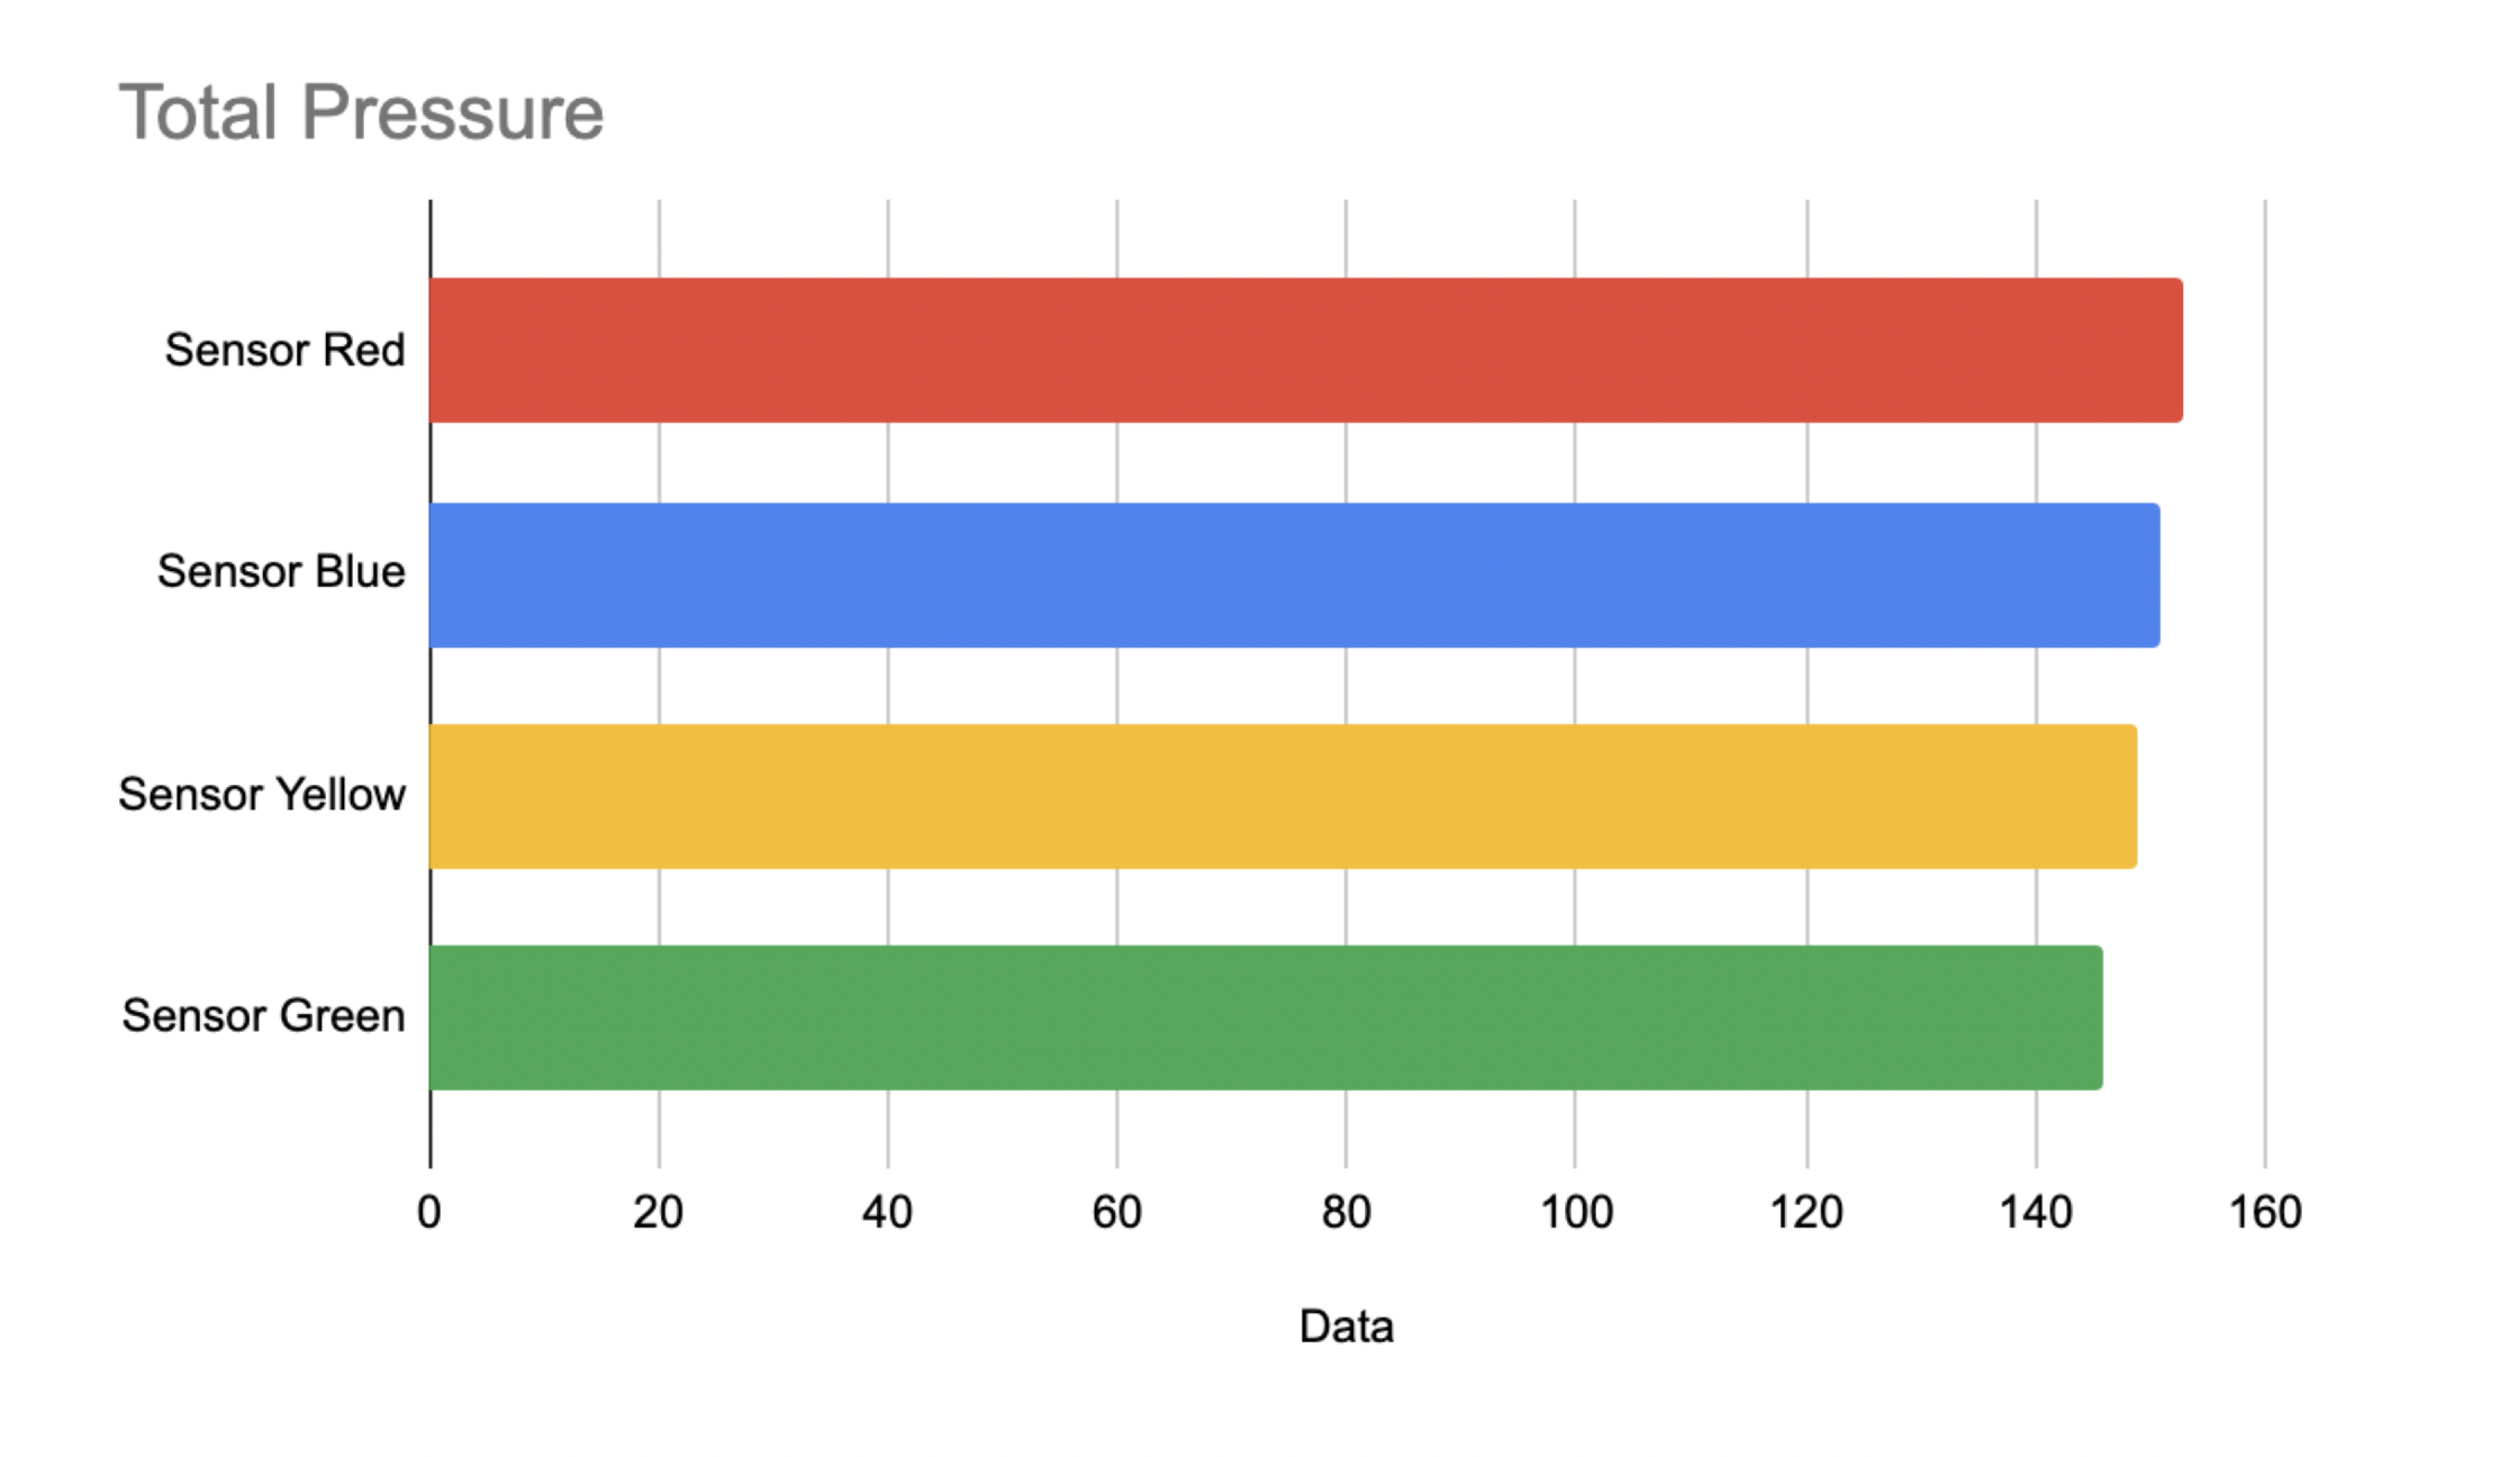
Due to the interference between close sensor points and some minor issues with the code, for easier visualization, we categorized the data collected from 15 sensor points into four sections.

Data
We also discovered that 2 out of 7 participants' assessments of the pressure they experienced during all tasks differed from the actual data. Walking was classified as moderate difficulty, and climbing stairs was classified as slight difficulty, as can be seen in the bottom two photos. The data indicates that walking actually caused less pressure than standing on tiptoes and that climbing stairs actually caused more pressure than walking.
We also discovered some other fascinating things, like the fact that some participants did not experience obvious discomfort because of the neoprene's thickness because it served as cushioning. Some people also found the wearable sensor to be confusing and the data it produced (when pressing multiple sensor points) to be unclear.
Final Designs
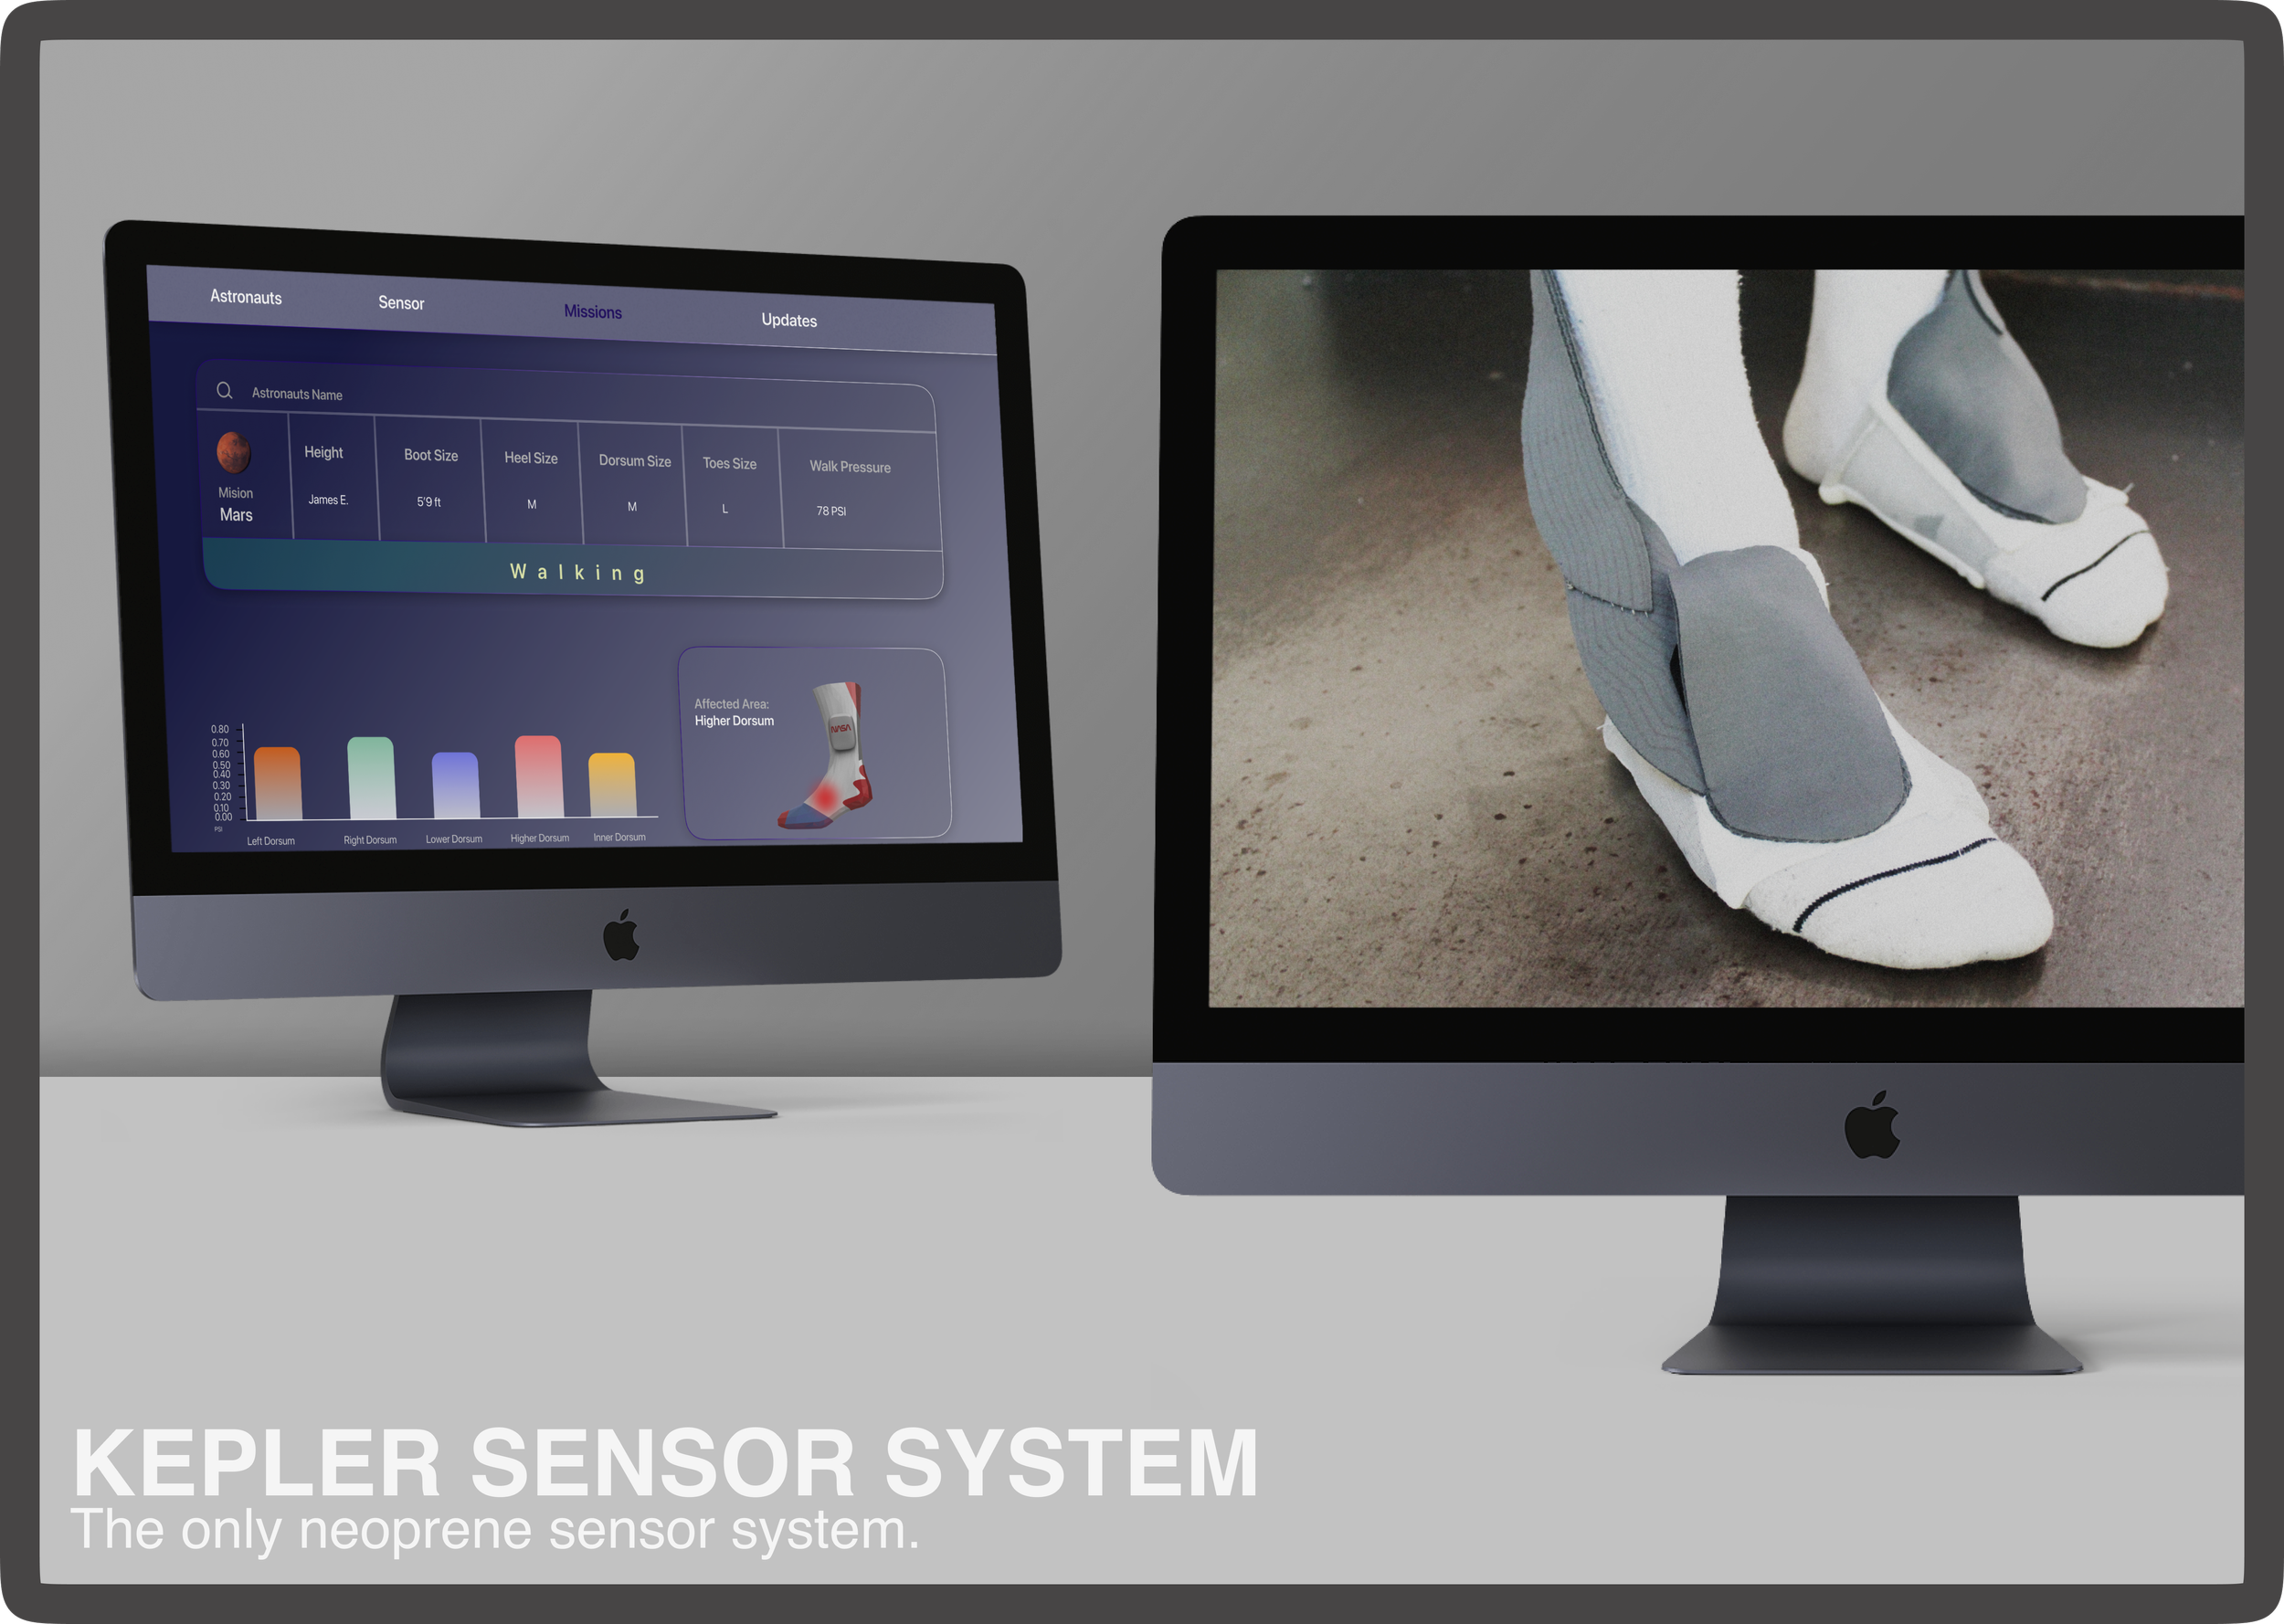
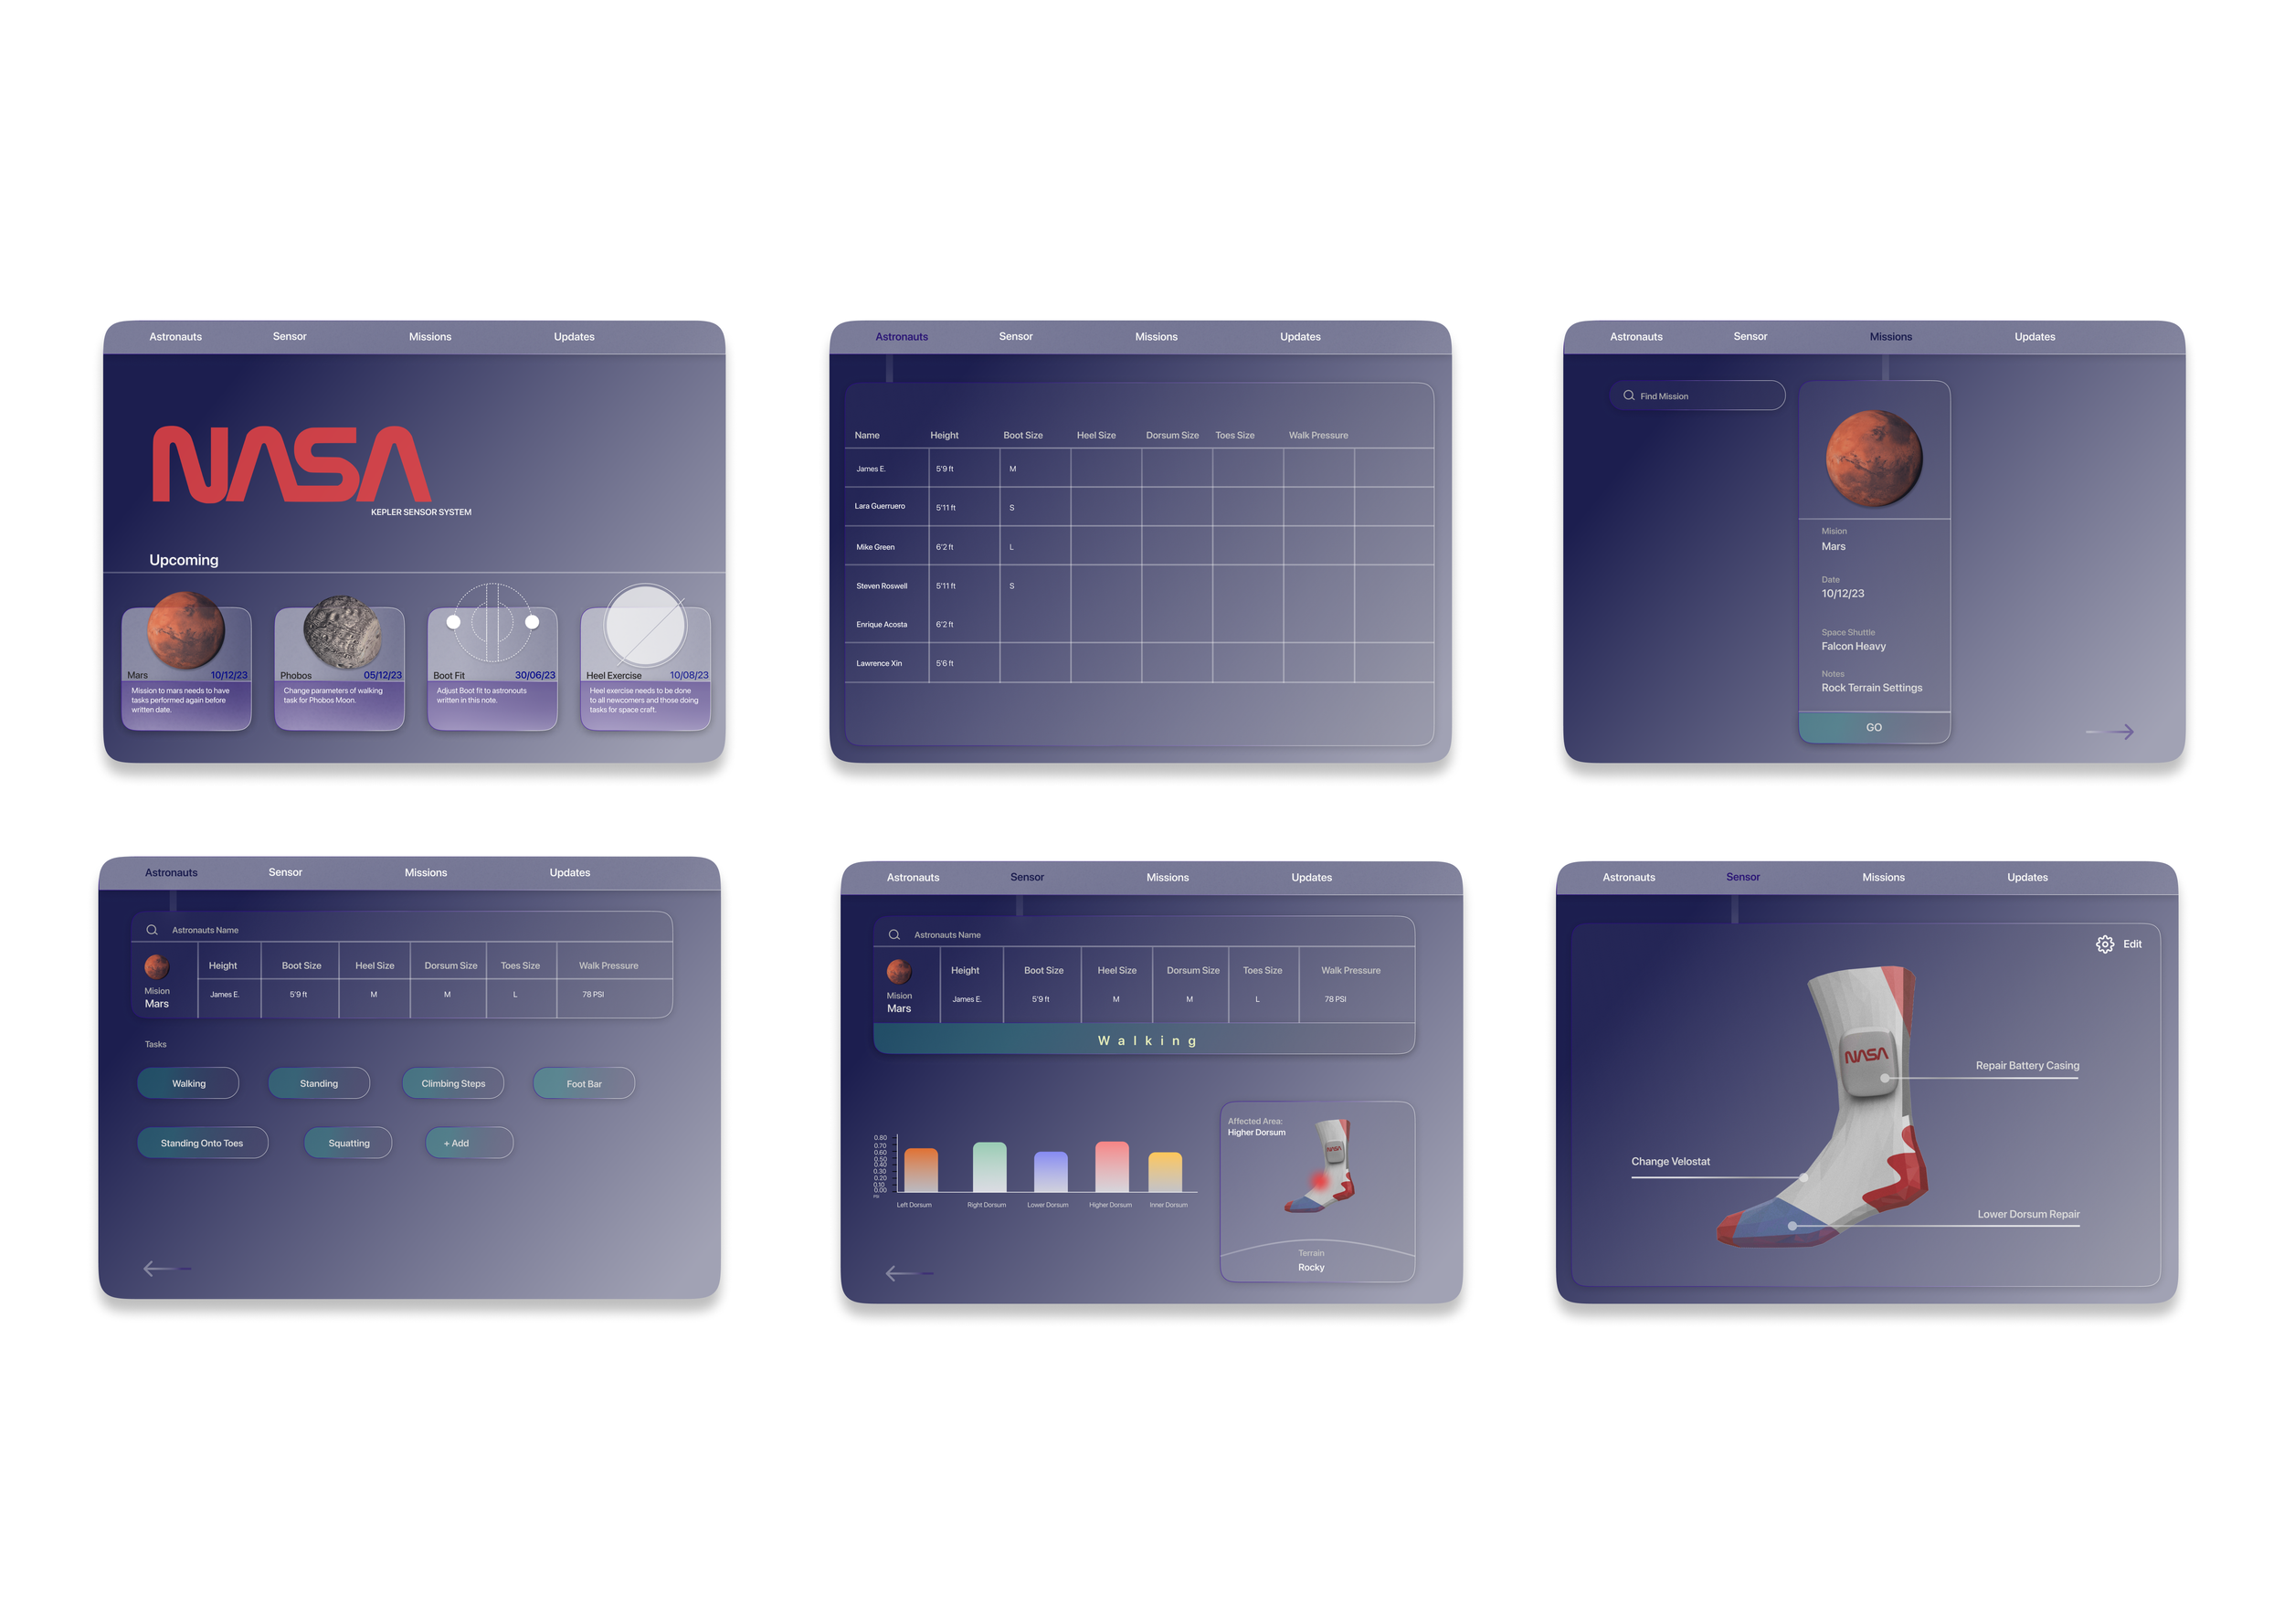
They expressed their appreciation for the sensor system's overall concept after the last briefing with NASA mentors. They also mentioned how beneficial it might be to have a sensor interface built in that would enable further annotation and tracking of each astronout for various missions.

CONCLUSION
Things to consider
The interface’s final product was just a concept, it would be great to turn Arduino’s screen into a more specific live graph when doing the usability test.
1-Usability testing should be performed with new UI screens.
2- Kepler sensor systems should be wireless.
3- Have a 3D image of the dorsum so that it is easier to see where the discomfort is happening.